
- USD/MXN hits two-month highs at 17.4256, up almost 4% for the week.
- Initial US jobless claims were flat, despite a weak ISM non-manufacturing PMI.
- The surprise rate cut by the Central Bank of Brazil could set a precedent for other Latin American central banks, although the Bank of Mexico maintains its restrictive monetary policy.
He Mexican Peso (MXN) plunges sharply against the US dollar (USD), racking up losses of 2% on Thursday and 4% for the week spurred on by rising US Treasury yields and by traders beginning to unwind the carry trade . In addition, the surprise 50 basis point rate cut by the Brazilian Central Bank could set the tone for other Latin American central banks. At the time of writing this report, the pair USD/MXN It is trading at 17.3617 after hitting a daily low of 16.9800.
The Mexican Peso plunges against the USD, boosted by the strong performance of the Dollar and the negative sentiment after the downgrade of the US credit rating by Fitch
Wall Street is trading in negative territory as investor sentiment remains depressed, partly due to Fitch’s downgrade of the US credit rating. Also, the strength of the US Dollar (USD) in general underpins the rise of USD/MXN, which reached a two-month high of 17.4256 in the early hours of the North American session, as data from the United States (US) crossed the cables.
Initial claims for unemployment benefits for the week ending July 29 rose by 227,000, in line with estimates, the US Bureau of Labor Statistics (BLS) reported. Reporting that the labor market is easing, but the trend remains uncertain, with mixed releases over the last couple of months with data showing otherwise.
Elsewhere, the July ISM Non-Manufacturing PMI, also known as the Services PMI, came in at 52.7, below June forecasts of 53 and 53.9. Digging deeper into the data, a gauge of prices paid by utility companies rose to 56.8 from 54.1 in June, reflecting the stickiness of inflation in service activity.
Aside from these data, the US Nonfarm Payrolls report for July is expected to provide a clear read on the labor market. Any upward surprise could bring further rate hikes by the US Federal Reserve (Fed) on the table. Otherwise, the Fed may take a dovish stance ahead of the September policy meeting.
Another cause of the USD/MXN is the rise in US Treasury bond yields. The 10-year yield gains eight basis points to 4,171%, its highest level since November 2022.
Meanwhile, Richmond Fed President Thomas Barkin made remarks, saying inflation is too high, “last month’s inflation reading was good, and I hope that’s a sign.”
Apart from this, the Central Bank of Brazil delivered a moderate surprise, cutting rates 50 basis points to 13.25%, from the 25 basis points estimated by analysts, giving a moderate forward guidance saying: “If the scenario evolves as wait, Committee members unanimously anticipate further reductions of the same magnitude at future meetings.”
That is opposed by the deputy governor of the Bank of Mexico (Banxico), Jonathan Heath, who said on Wednesday that “the restrictive monetary policy stance must be maintained for a while to wait for it to take effect,” he said in an interview on the Banorte podcast . However, he said that interest rates, which the TIIE places at 11.25%, are “correct” even if the Fed raises again.
USD/MXN Price Analysis: Technical Perspective
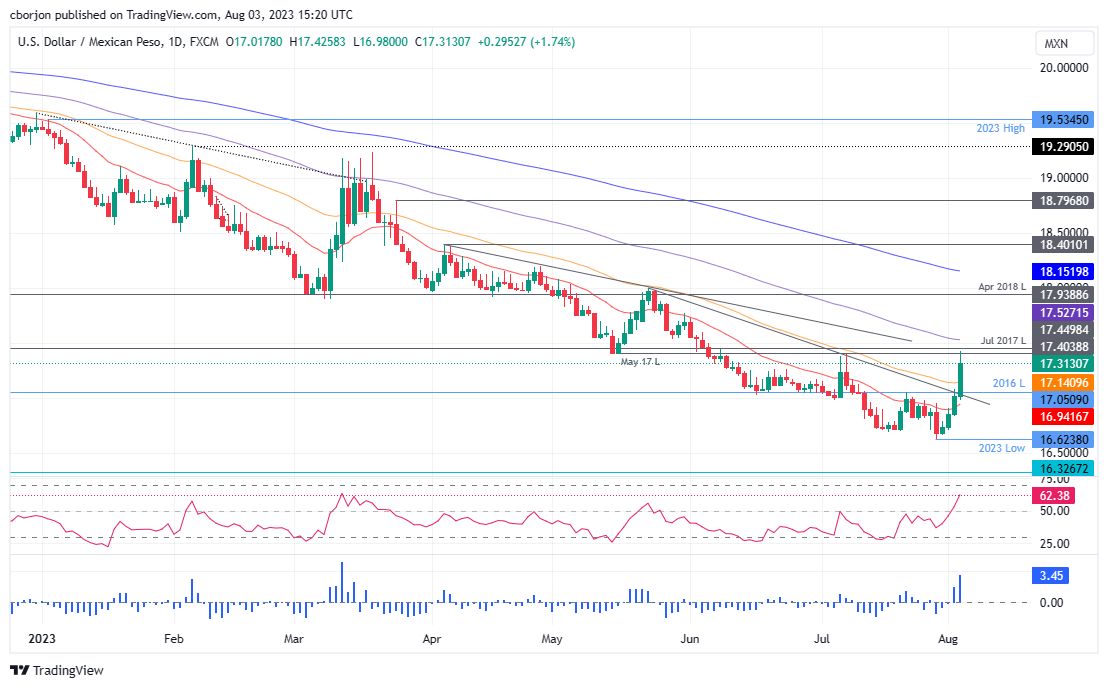
USD/MXN is staging an exceptional recovery, hitting 17.4256 as a daily high, hitting a fresh two-month high, but failed to break essential resistance found at the May 17 daily low at 17.4038. On a daily close above the latter, USD/MXN could rally towards the 100-day EMA at 17.5273, with buyers keeping an eye on the May 24 high at 17.9798, followed by the 200-day EMA. at 18.1520. Conversely, if USD/MXN falls below 17.0000, it could exacerbate a retest of year lows around 16.6238.
Source: Fx Street
I am Joshua Winder, a senior-level journalist and editor at World Stock Market. I specialize in covering news related to the stock market and economic trends. With more than 8 years of experience in this field, I have become an expert in financial reporting.


