
- Nonfarm payrolls for July came in at 187,000, below the 200,000 forecast. However, average hourly earnings were up 4.4% year-on-year, pointing to possible wage pressure.
- Michelle Bowman hints at further rate hikes to control inflation. By contrast, New York Fed President John Williams suggests that rate cuts could start as early as 2024.
- Commerzbank estimates that the USD/MXN would reach 17.60 in June 2024 and 18.00 in December of the same year.
USD/MXN picks up some ground on Monday, although it is still trading away from the day’s highs at 17.1505, and remains above its opening price by 0.03%. At the time of writing, the USD/MXN is trading at 17.0649 after reaching a daily low of 17.0220.
USD/MXN benefits from Bowman’s hawkish Fed comments and also higher US Treasury yields.
US stocks are trading higher after a mixed US jobs report last Friday. Although July non-farm payrolls of 187,000 came in below estimates of 200,000, showing that the labor market is cooling off, average hourly earnings (AHE) increased from 4.2% to 4, 4% yoy shows that wage pressure could reignite a rise in inflation, which the US Labor Department will release on August 10.
Estimates for the Consumer Price Index (CPI) in the United States point to a drop in inflation to 3% from 3.3% in June, while the core CPI, which excludes volatile elements, would slow to 4.7% yoy from 4.8% in June.
USD/MXN rose on Monday on hawkish comments from Michelle Bowman, who said the Fed would probably have to raise rates further to reduce inflation. On the dovish end of the spectrum, New York Fed President John Williams has signaled that rate cuts could begin as early as 2024, depending on economic data and if the inflation trend continues to fall.
The Dollar Index (DXY), a gauge of the dollar’s value against a basket of six currencies, is holding on to gains of 0.09% at 102.100, a tailwind for USD/MXN. One reason for the dollar’s strength is that US Treasury yields are picking up ground, with the benchmark 10-year US note rate at 4.082%, two basic points more.
In Mexico, the economic agenda reported that Consumer Confidence for July stood at 46.2, surpassing the forecasts of 44.9 and the upwardly revised figure of 45.3 for June. The CPI of Mexico will be known on August 9. The forecasts for the CPI stand at 4.78% year-on-year, while for the month-on-month it is expected to be 0.48%. Weak inflation data would prevent the Bank of Mexico (Banxico) from tightening conditions after three successive meetings in which it kept rates unchanged.
Commerzbank analysts revised their forecasts for the USD/MXN towards the end of the year, estimating that the USD/MXN would be around 17.2000. They added that “the weakening of the US economy and political risks are likely to weigh on the Peso.” They estimate that the USD/MXN would stand at 17.6000 before the US general elections in Mexico and at 18.0000 towards the end of 2024.
USD/MXN Price Analysis: Technical Perspective
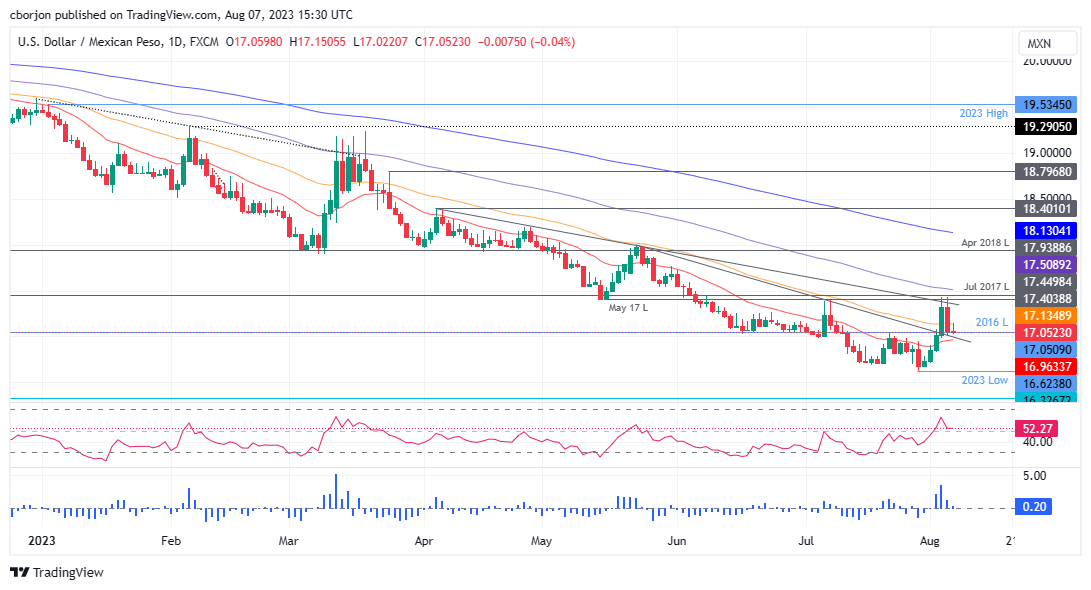
USD/MXN remains biased to the downside, but a “double bottom” chart pattern formed around the year’s lows could open the door for further gains. Resistance levels emerge at a four-month resistance trend line passing around 17.40, followed higher by the 100 day EMA at 17.5093. If USD/MXN buyers break above these two resistance levels, the pair could challenge the psychological level of 18.00, followed by the 200 day EMA at 18.1306. On the downside, USD/MXN could fall below 17.0000 and retest the year-to-date (YTD) low of 16.6238.
Source: Fx Street
I am Joshua Winder, a senior-level journalist and editor at World Stock Market. I specialize in covering news related to the stock market and economic trends. With more than 8 years of experience in this field, I have become an expert in financial reporting.


