
- USD/MXN was down 0.30% in the second half of 2023 on the back of weak US manufacturing data and a yield curve inversion.
- US manufacturing activity slows for eighth consecutive month, weighing on USD performance.
- Recession fears are mounting as the US yield curve inverts sharply, signaling a possible economic slowdown.
He USD/MXN begins the second half of 2023 with losses close to 0.30% after reaching a daily high of 17.1485 after data from the United States (US) showed that manufacturing activity continues at depressed levels. In addition, the deep inversion of the US yield curve sparked recession fears, a headwind for the US dollar (USD). At the time of writing, the USD/MXN pair is trading at 17.0467.
Sluggish US manufacturing and yield curve inversion weigh on USD/MXN exchange rate outlook
US manufacturing activity slowed for eight straight months, the Institute for Supply Management (ISM) revealed, with June data coming in below May’s 46.9 at 46.0. Going deeper into the report, prices paid for manufacturing slowed down for the third consecutive month, unlike services, although it remains above 39.40 in December 2022. In the services sector, input prices remain high due to to wage growth, reflecting a tense labor market.
As for traders, expectations for a 25 basis point rate hike in July were unchanged from last Friday’s odds at 87%, as CME’s FedWatch tool shows. However, data released today pushed the odds for the November FOMC meeting down to 33%.
Of note, USD/MXN should be cautious as recent data put aside fears of a Recession, but last Friday’s US inflation report lowered expectations that the Federal Reserve (Fed) would hike two times the interest rate towards the end of 2023. However, the US dollar index (DXY), which measures the evolution of the dollar against a basket of currencies, advanced 0.03%, to 102.951, thanks to the recovery of the yield of US Treasury bonds.
The US yield curve has experienced its steepest inversion since March 2023, with a negative spread of -1,078%. This evolution is due to the fact that the 2-year US yield has reached 4,923%, while the 10-year yield stands at 3,843%. This reversal indicates that investors anticipate the potential impact of continued Fed tightening, which could lead to a slowdown in economic growth and even the risk of a recession.
Across the border, the latest Mexico jobs report, released on Friday, dealt a setback for the Mexican Peso (MXN). Meanwhile, data released Monday by S&P Global showed the June manufacturing PMI came in at 50.90, up from 50.50 in May.
For its part, the Bank of Mexico (Banxico) reported that remittances in May amounted to 5.7 billion dollars, breaking a monthly record, according to the central bank. Apart from this, Banxico’s survey showed that most analysts estimate that interest rates will end at 11.00% in 2023, while they revise inflation downwards. Regarding the USD/MXN exchange rate, most analysts expect the pair to end the year at 18.33 pesos per dollar, down from 18.96 in the previous survey.
Therefore, the interest rate differential continues to favor USD/MXN lower, as the Fed is expected to raise rates to 5.25%-5.50%, as shown by money market futures, while the estimates that Banxico ends at 11%. This would likely limit potential gains for the USD/MXN.
USD/MXN Price Analysis: Technical Perspective
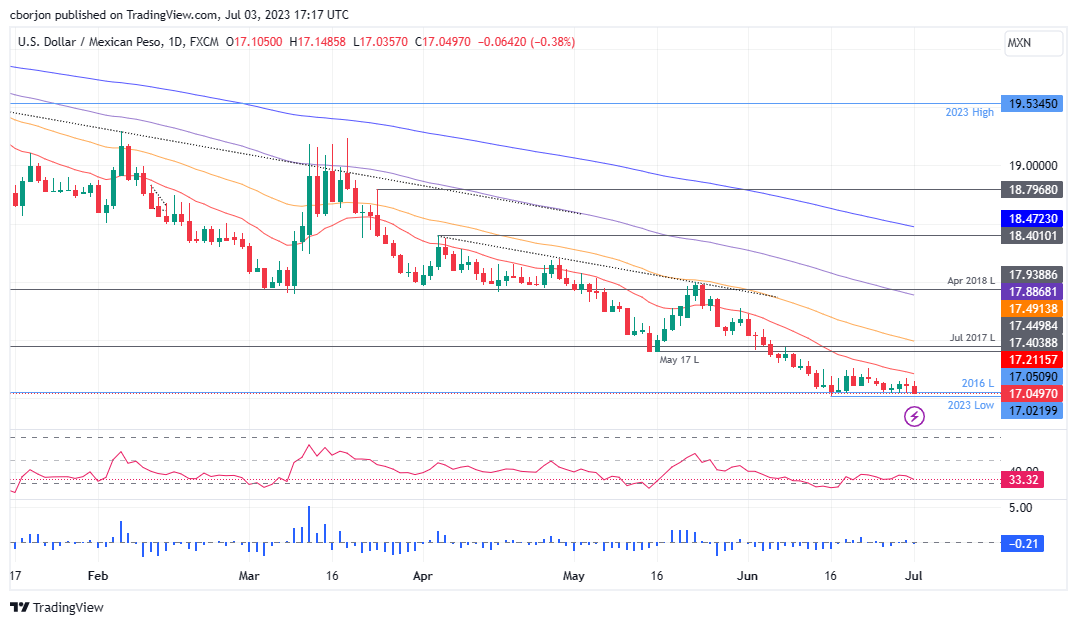
From a technical perspective, USD/MXN would likely extend its downtrend as it approaches the 17.00 barrier, threatening to hit levels last seen in October 2015 at 16.3267 before USD/MXN sellers approach the 16.00 figure. On the other hand, buyers of USD/MXN are still unable to recover the 20-day exponential moving average at 17.2113, which, once broken, the USD/MXN pair could recover towards the May 26 low turned into resistance at 17.4038. before testing the 50-day EMA at 17.4912.
Source: Fx Street
I am Joshua Winder, a senior-level journalist and editor at World Stock Market. I specialize in covering news related to the stock market and economic trends. With more than 8 years of experience in this field, I have become an expert in financial reporting.


