
- The US JOLTs report showed a decline of 632,000 job vacancies in February.
- US factory orders fell in February, caused by rising borrowing costs.
- Money market futures estimate a 57% chance of a pause in the Fed’s tightening cycle.
Despite the weakness of the dollar, the Mexican Peso (MXN) loses ground against US dollar (USD). Deteriorating market sentiment and worse than expected US economic data stimulated capital outflows from emerging markets. At the time of writing, the USD/MXN is trading at 18.1170, up 0.34%.
USD/MXN rises on risk appetite
US stocks continue to trade in negative territory, while US Treasury yields plunge. Data released by the US Department of Labor showed job vacancies fell by 632,000 to 9.9 million, according to the February JOLTs report. At the same time, factory orders fell 0.7%m/m in February, recovering slightly from January’s 2.1% drop.
Following the latest reports, investors increased their bets that the US Federal Reserve (Fed) will pause its tightening cycle. Money market futures estimate the probability of a pause at 57%, up from 43% on Monday. The forecast of 25 basis points stands at a probability of 43%.
The US dollar index (DXY), an indicator that measures the behavior of six currencies against the US dollar (USD), fell 0.44% to 101.591, helped by falling US Treasury bond yields. The plunge in US bond yields came as traders repriced for a less hawkish Federal Reserve.
The absence of the Mexican economic agenda left the USD/MXN adrift of the sentiment and the dynamics of the US dollar. Bad news for the US economy is beginning to weigh on the dollar, with investors leaning towards growth as inflation cools.
USD/MXN Technical Analysis
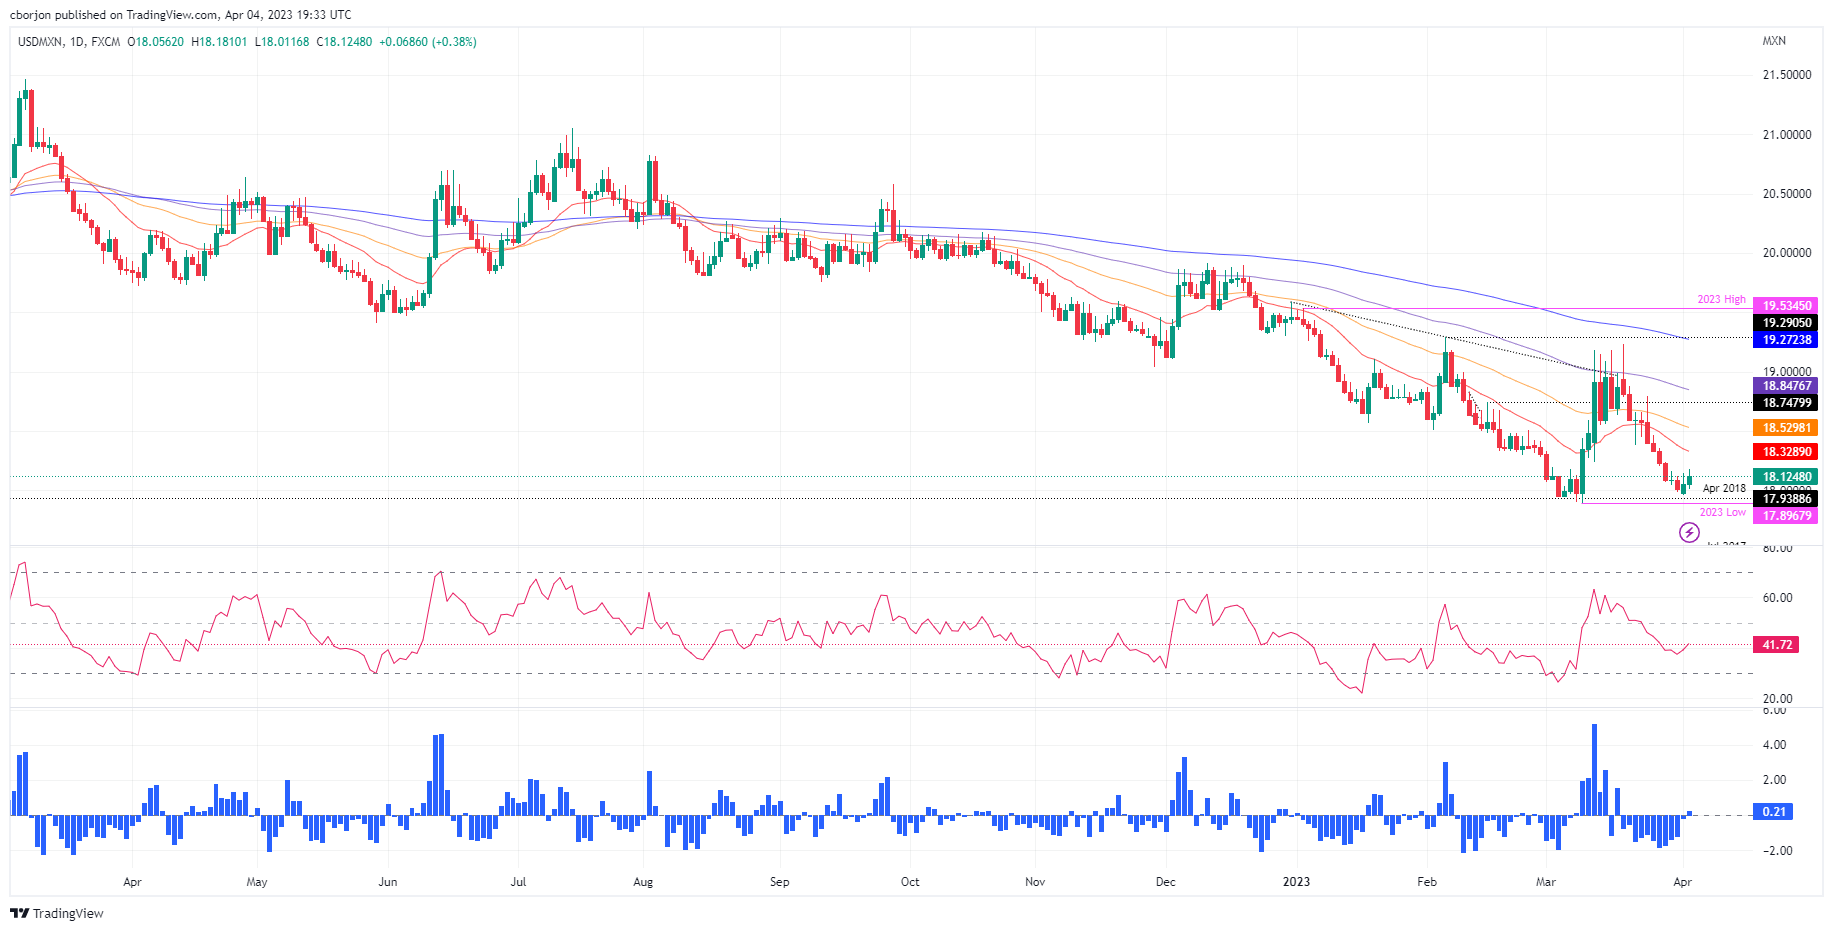
USD/MXN seems to have bottomed around the weekly low of 17.9644, hit on Monday. A double bottom emerged, although the USD/MXN needs to retrace the 20, 50 and 100 day EMAs in the short term, so the chart pattern could still be in play. Therefore, if the USD/MXN breaks out of the 100-day EMA at 18.8477, it could open the door for further gains. That being said, the next USD/MXN resistance would be 19.0000, followed by the March 20 high at 19.2327 and the February 6 high at 19.2905, before targeting the year high at 19.5345.
Source: Fx Street
I am Joshua Winder, a senior-level journalist and editor at World Stock Market. I specialize in covering news related to the stock market and economic trends. With more than 8 years of experience in this field, I have become an expert in financial reporting.


