
- US job growth beats estimates, but USD/MXN loses 0.12%.
- Rising US Treasury yields provide some support for USD/MXN.
- The Banco de México’s stance on record interest rates adds resistance to the peso.
USD/MXN pared some of its losses but is still trading negative, despite a strong US jobs report released before the Wall Street open, which did not stop the Mexican peso from hitting fresh weekly lows. Improved trader sentiment, seen in US stock gains, cushioned the MXN’s decline against its US dollar (USD) counterpart. At the time of writing, the USD/MXN pair is trading at 17.5308, down 0.10%.
MXN holding firm amid strong US jobs data and rising US Treasury yields.
USD/MXN fell sharply from around 17.5000 towards weekly lows of 17.4190 after the US Bureau of Labor Statistics (BLS) revealed May Non-Farm Payrolls crushed analyst estimates of 190,000 , with the economy adding 339,000 jobs. Although the headline number is impressive, if we dig a little deeper, the unemployment rate jumped from 3.4% to 3.7%. As for wages, inflation, known as mean hourly earnings, rose 0.3% mom, but dipped from 4.4% in April to 4.3%.
Later, USD/MXN rallied, close to erasing its earlier losses, as traders digested the US jobs report, underpinned by rising US Treasury yields. The reference 10-year note rate is 3.69%, ten basis points (bp) above Thursday’s close.
Meanwhile, the Dollar Index (DXY), an indicator of the value of the dollar against a basket of six currencies, advances 0.47%, above 104,000, about to end the week with losses of 0.17%.
Across the border, the Mexican unemployment rate for April was 2.8%, above estimates of 2.7%. On the other hand, the last minutes of the meeting of the Bank of Mexico (Banxico) showed a cooling of inflation and inflationary pressures, after the bank maintained the values in its portfolio at 11.25%. On Wednesday, the governor of Banxico, Victoria Rodríguez Ceja, stated that the institution she commands would keep rates at all-time highs for at least the next two meetings.
USD/MXN Price Analysis: Technical Perspective
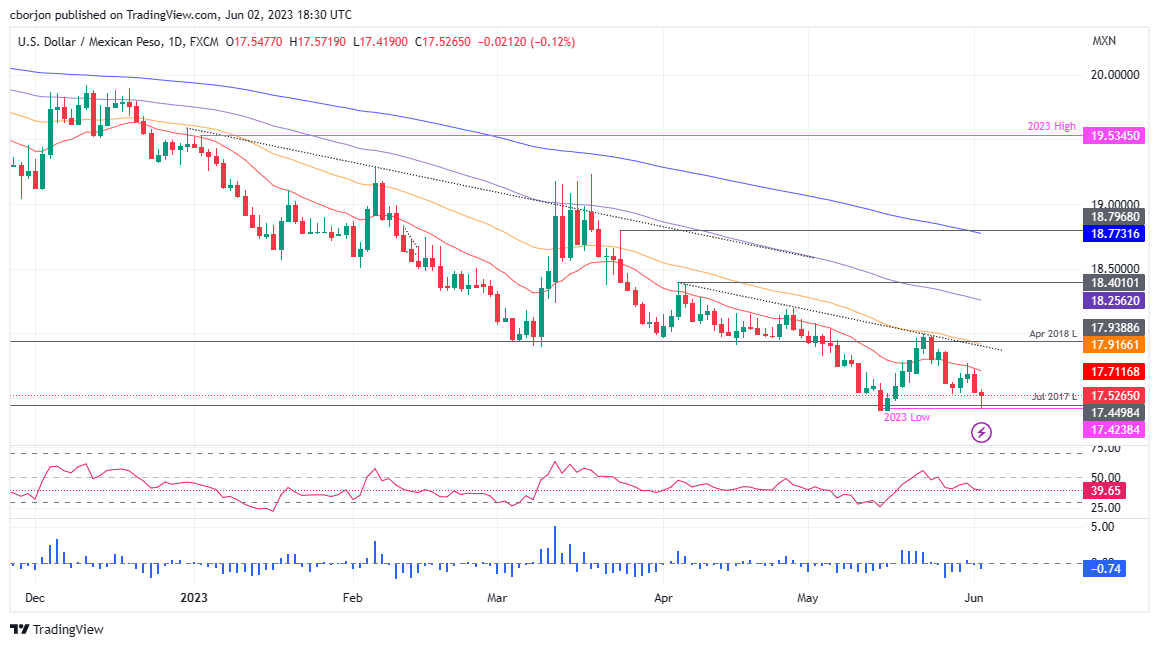
Given the fundamental background, USD/MXN remains biased to the downside, but recent price action could form a double bottom. Even if it’s just a double dip towards the 17.4000 area, it’s worth keeping in mind given the latest downtrend, which started in November 2021, with the USD/MXN plunging 20%. If the USD/MXN breaks above that support, the next stop would be the 17.0000 figure. Otherwise, if the USD/MXN recovers to the 18.000 figure, it will adjust to the double bottom. Above this zone, the next stop for USD/MXN would be the 100-day EMA at 18.2563, followed by the April 5 daily high at 18.4010.
Source: Fx Street
I am Joshua Winder, a senior-level journalist and editor at World Stock Market. I specialize in covering news related to the stock market and economic trends. With more than 8 years of experience in this field, I have become an expert in financial reporting.


