
- USD/ZAR fell below the 20-day SMA after reaching a high near 19,150.
- The South African CPI for September beat forecasts, as did retail sales.
- Safe haven flows dominate markets, and attention shifts to geopolitics.
At the end of the week, the USD/ZAR is trading with slight losses at 19,000, with the ZAR holding up buoyed by good inflation figures reported on Thursday. On the dollar side, it is trading lower against its rivals, but a sour market with investors focusing their attention on tensions in the Middle East could reignite the USD’s momentum.
In September, the South African Consumer Price Index (CPI) stood at 5.4% year-on-year, above the 5.3% forecast and 4.8% previously. In line with this, the ZAR gained momentum as markets now expect the South African Reserve Bank (SARB) to keep rates higher for an extended period of time as it targets inflation between 3 % and 6%. In its October Monetary Policy Review on Tuesday, the bank stated that rising oil prices and drought were negatively affecting inflation prospects. Still, the bank did not hint at further hikes, instead confirming that it will keep rates unchanged at this level for an extended period.
On the dollar side, it is likely to close the week with losses close to 0.40%, and the green currency faced selling pressure on Thursday following Jerome Powell’s words in which he hinted that the rise in bond yields would be will be taken into account in upcoming monetary policy decisions. That said, the US economy remains strong, and Powell left the door open for another hike in 2023, which could limit the dollar’s decline. Furthermore, the growing escalation in the Middle East could fuel safe haven flows, which would benefit the Dollar as investors could seek refuge there.
USD/ZAR Levels to watch
Analyzing the daily chart, a neutral to bearish technical picture is seen for USD/ZAR, suggesting that the bears are gaining momentum but still do not have the advantage over the bulls in the short term. The Relative Strength Index (RSI) has turned flat above its midline, while the Moving Average Convergence (MACD) prints flat red bars. Furthermore, the pair is below the 20-day SMA, but above the 100-day and 200-day SMA, indicating a favorable position for the bulls in the overall picture.
Support levels: 18,905, 18,800, 18,701 (100-day SMA).
Resistance levels: 19,050 (20-day SMA), 19,157, 19,250.
USD/ZAR Daily Chart
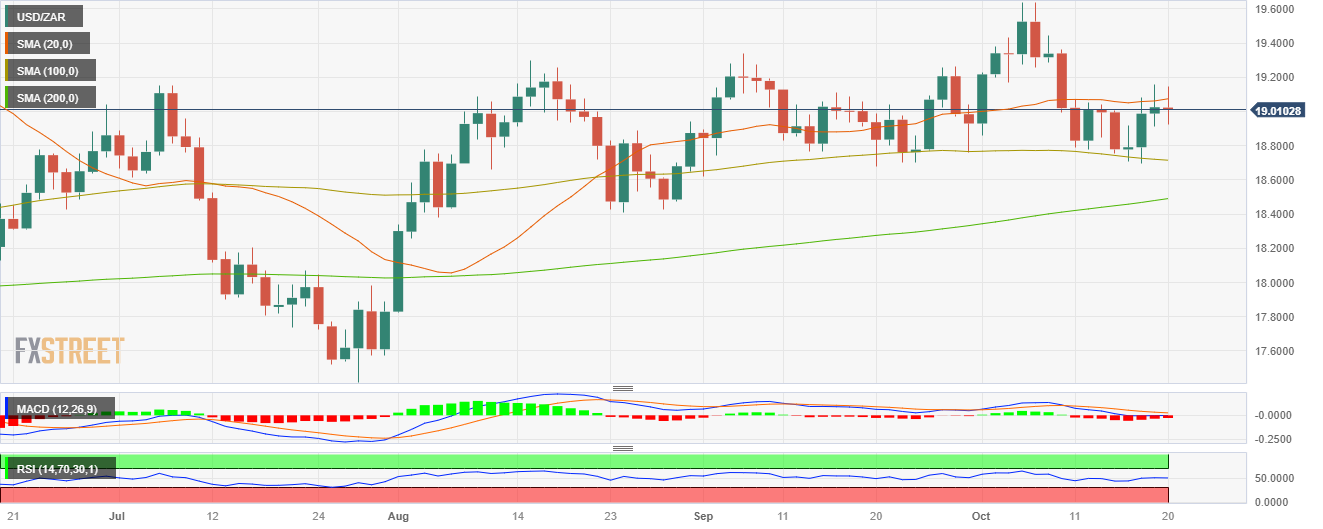
Source: Fx Street
I am Joshua Winder, a senior-level journalist and editor at World Stock Market. I specialize in covering news related to the stock market and economic trends. With more than 8 years of experience in this field, I have become an expert in financial reporting.


