
- A series of economic data from the United States strengthened the dollar and limited the fall of the USDCAD.
- The Canadian Consumer Price Index for the month of October was unchanged, weakening the Loonie.
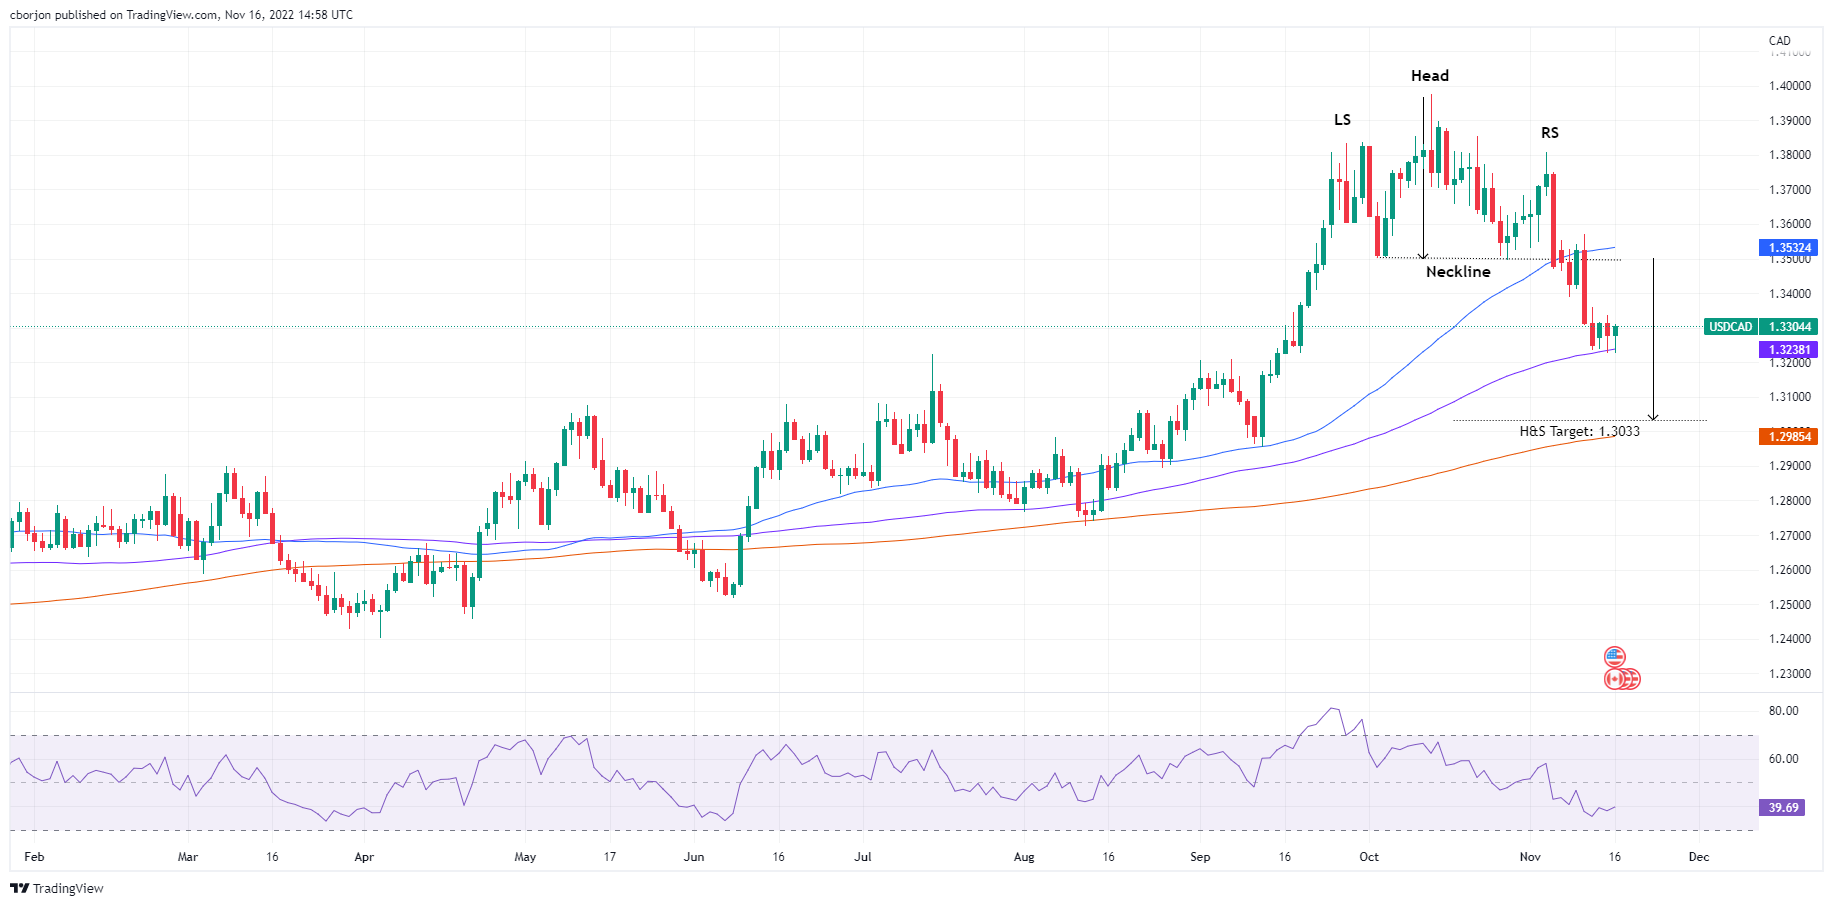
- USDCAD Price Analysis: The head-shoulder pattern remains in place, but sellers need to break the 100 day EMA.
The USDCAD remains subdued after US economic data showed consumer resilience, while Canada’s inflation appeared to pause after a report. In addition, a risk aversion boost, spurred by an upbeat US sales report, capped the USDCAD’s decline. At the time of writing, USDCAD is trading at 1.3304, up 0.21% from its opening price.
US Retail Sales showed consumer spending increased
US stock futures point to a lower open. The US Department of Commerce reported that October US Retail Sales rose to the most in eight months, with readings reaching 1.3% MoM versus 1% expected by analysts. Digging deeper into the report, Retail Sales in the control group, used to calculate Gross Domestic Product (GDP), expanded 0.7% MoM versus the consensus 0.3%.
Although Federal Reserve officials have expressed a desire to moderate interest rate hikes, resistance from US consumers would complicate their job. However, keep in mind the latest Fed monetary policy statement, in which they stated that “the Committee will take cumulative monetary policy tightening into account”, so traders better watch for the reaction of those responsible for the Fed before the Retail Sales report.
Other US data revealed during the day was that Industrial Production (IP) slumped from 0.1% in September to -0.1%m/m, below estimates for a 0.2% rise. According to the report, “capacity utilization decreased 0.2% in October to 79.9%, a rate that is 0.3 percentage points above its long-term average (1972-2021).”
The Canadian Consumer Price Index was unchanged affecting the loonie
On the Canadian side, the Canadian Consumer Price Index (CPI) held at 6.9% year-on-year in October, mainly due to high gasoline prices and the Bank of Canada (BoC) rate hike. . In the same report, the core CPI figure, which excludes volatile items like food and energy, rose 5.3% yoy. CIBC analysts commented that Canada’s inflation rate spiked in October, but there was only a hint of better news in the underlying detail, as prices outside of food and energy posted a more moderate seasonally adjusted increase.
Given the amount of data released, USDCAD was almost unchanged around its opening price. However, it should be noted that the USDCAD bias is neutral to the downside, but faces solid support at the 100-day EMA at 1.3238.
USDCAD Price Analysis: Technical Perspective
The head and shoulders chart pattern holds as long as USDCAD rates continue to trade below the neckline, which is around 1.3500. The Relative Strength Index (RSI) shows that buyers are starting to gather momentum as it has stopped its decline and its slope has turned higher. However, until it crosses the mid-50 line, the sellers are still in control. USDCAD key support levels lie at the 100 day EMA, followed by the psychological level of 1.3200. Once broken, the decline towards the target of the head-shoulder pattern around 1.3030 would be compounded. Otherwise, if USDCAD buyers regain control, a retest of 1.3400 is anticipated.
Source: Fx Street
I am Joshua Winder, a senior-level journalist and editor at World Stock Market. I specialize in covering news related to the stock market and economic trends. With more than 8 years of experience in this field, I have become an expert in financial reporting.


