
- USDCHF will end the week with gains of over 1%, but the bias is bearish.
- In the short term, USDCHF has bottomed around 0.9350-0.9450, with buyers heading to 0.9600.
The USDCHF It is advancing for the fifth day in a row after falling more than 5% in the past week following a softer-than-expected US inflation report. However, hawkish comments from Federal Reserve (Fed) officials throughout the week lifted the US dollar (USD) at the expense of the Swiss franc (CHF). At the time of writing, the USDCHF is trading at 0.9536, gaining 0.26% from its opening price.
USDCHF Price Analysis: Technical Perspective
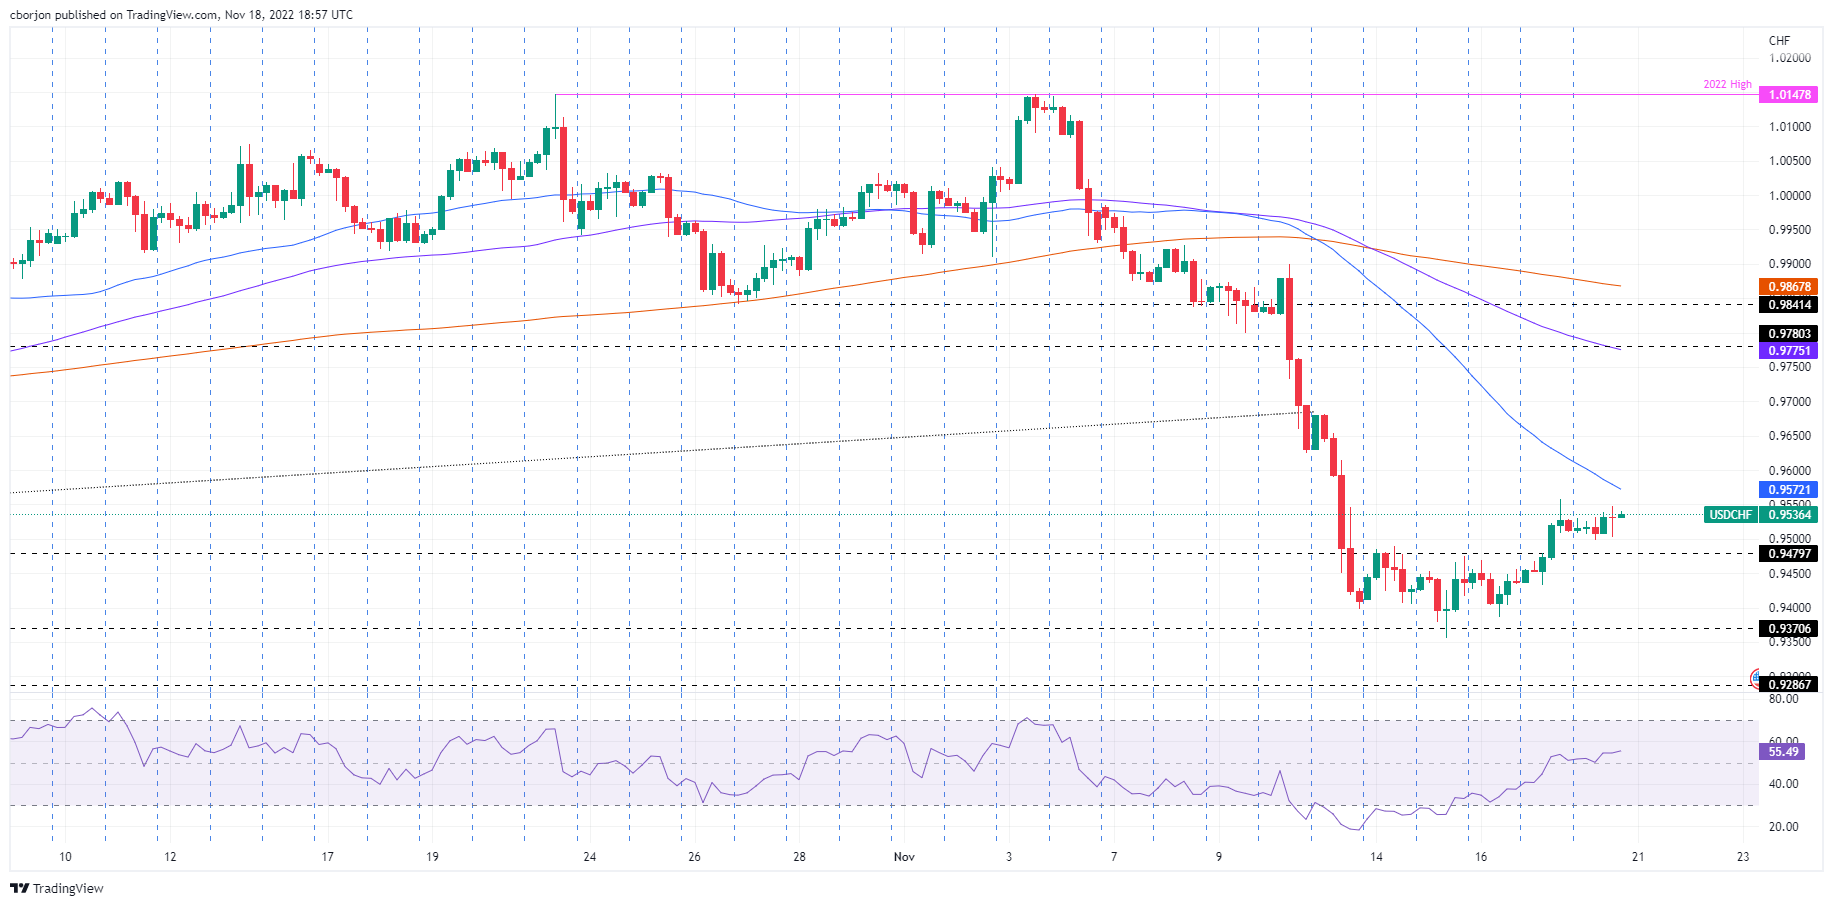
The USDCHF daily chart shows that the pair has a bearish bias. Based on last week’s price action, the USDCHF plunged below the 50, 100 and 200 day EMAs, while the Relative Strength Index (RSI) drifted towards oversold.
Once the USDCHF hit a new multi-month low around 0.9356, price action formed a candle hammer and the principal rallied towards the current exchange rate ever since. However, the bias remains intact as the RSI has broken out of oversold conditions but remains in bearish territory.
In the short term, the USDCHF 4-hour chart shows the main bottom around the 0.9350-0.9480 zone. On Thursday, the USDCHF broke higher, reaching a weekly high of 0.9557, but the major is consolidating around the 0.9500-0.9559 zone. If USDCHF breaks out of this zone, next resistance would be 0.9600, followed by the 11 Nov daily high at 0.9681, before 0.9700.
USDCHF Key support levels are found at the key psychological 0.9500 level. A break of the latter would expose the November 17 daily low at 0.9432, followed by November’s monthly low around 0.9356.
USDCHF Key Technical Levels
Source: Fx Street
I am Joshua Winder, a senior-level journalist and editor at World Stock Market. I specialize in covering news related to the stock market and economic trends. With more than 8 years of experience in this field, I have become an expert in financial reporting.


