
- USDJPY is in a coil and could be about to continue lower.
- US dollar bulls point to a correction towards 108.00, DXY.
The USDJPY it is relatively sideways on the session after falling from a high of 140.29 to a low of 138.72, and is now trading again at 139.30. The dollar has been under pressure, falling from currently elevated levels on sentiment that the Federal Reserve will be forced to pause its rate hikes. As interest rate differentials with other countries narrow, the dollar is expected to continue to fall. This sentiment is fueling supply in the yen, as the following technical analysis illustrates:
USDJPY daily chart
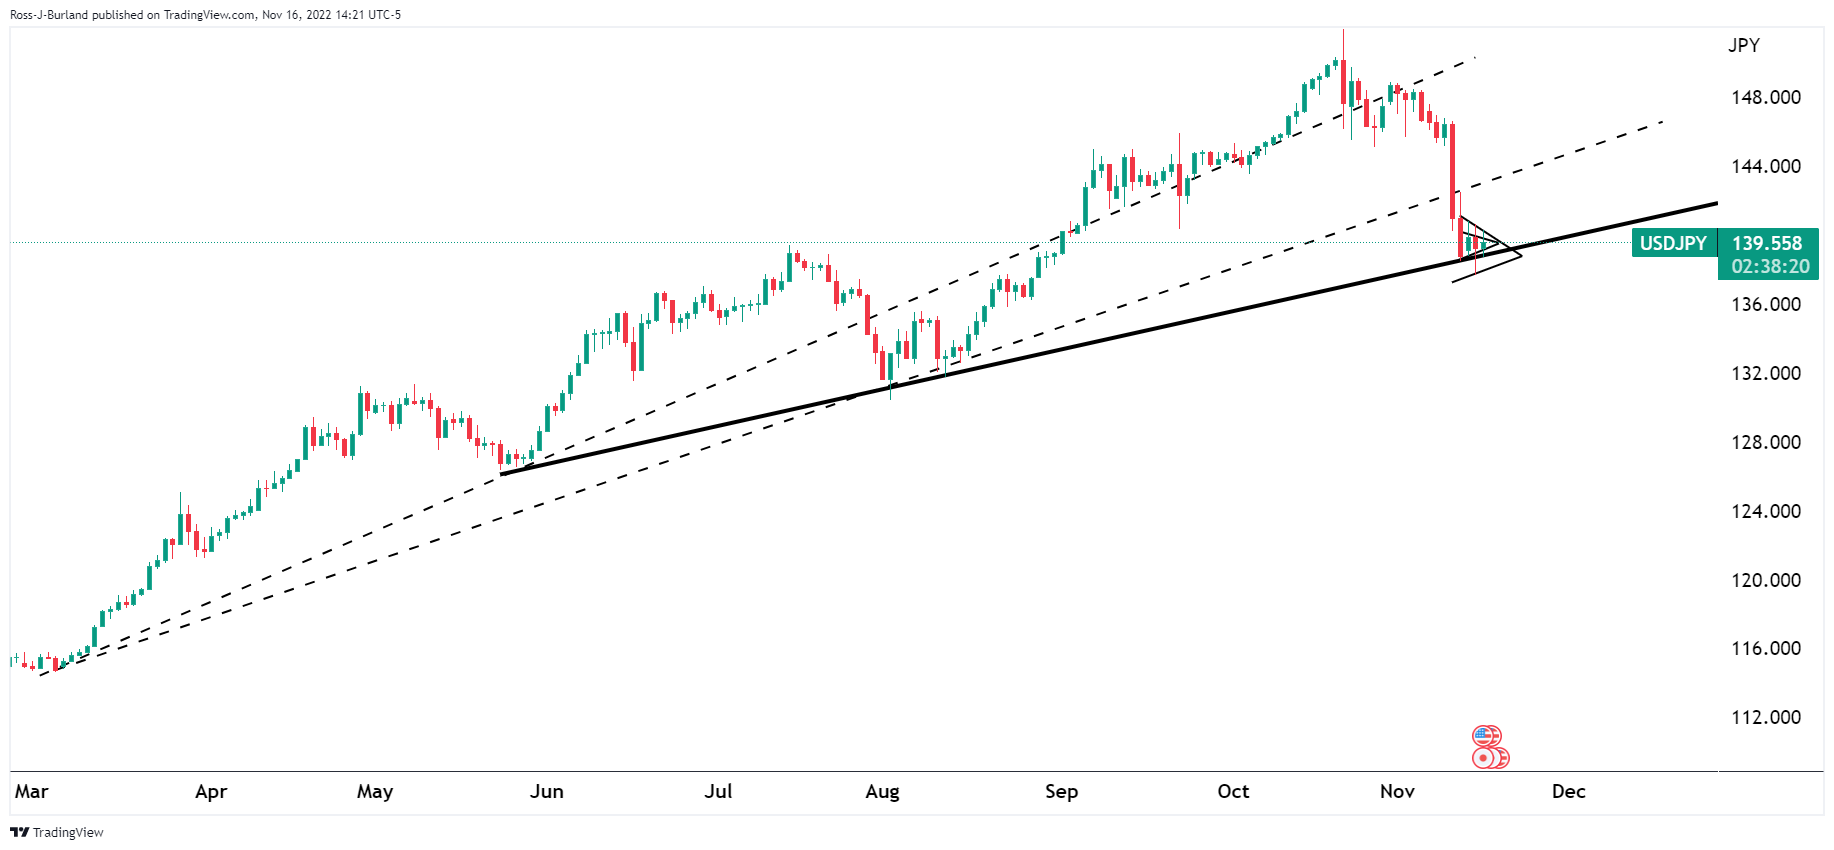
The price has broken previous support trend lines and is now encountering new dynamic support and is rolling into a bearish continuation triangle.
USDJPY H4 chart
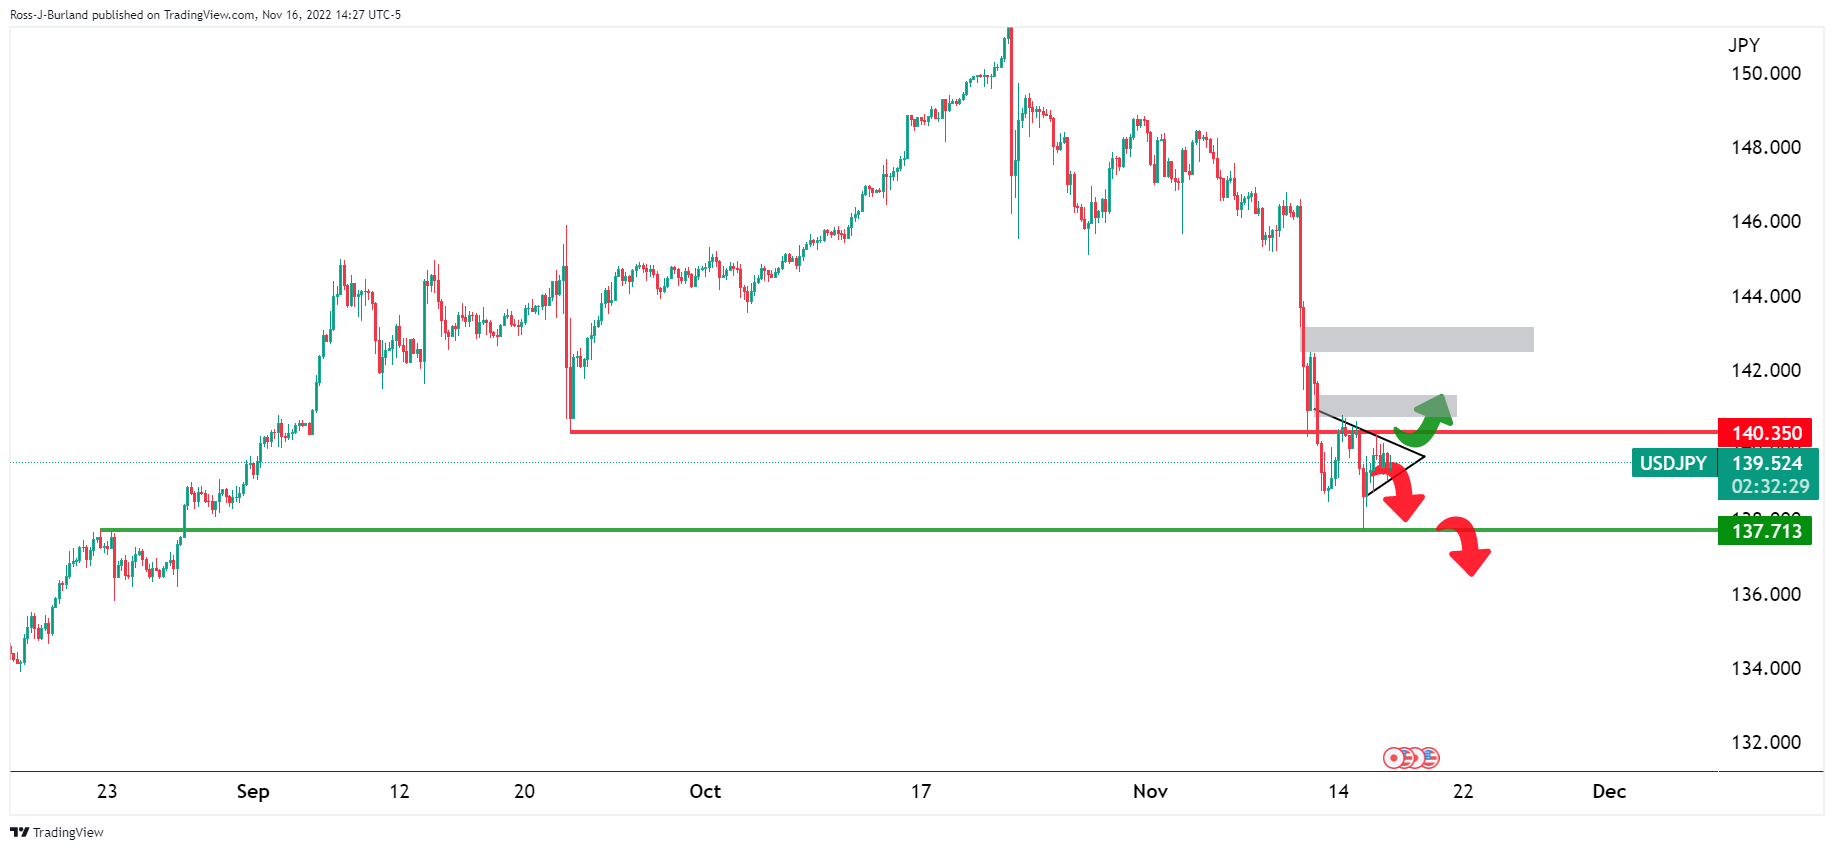
On the 4 hour chart we can see the important levels and price imbalances in case of a breakout.
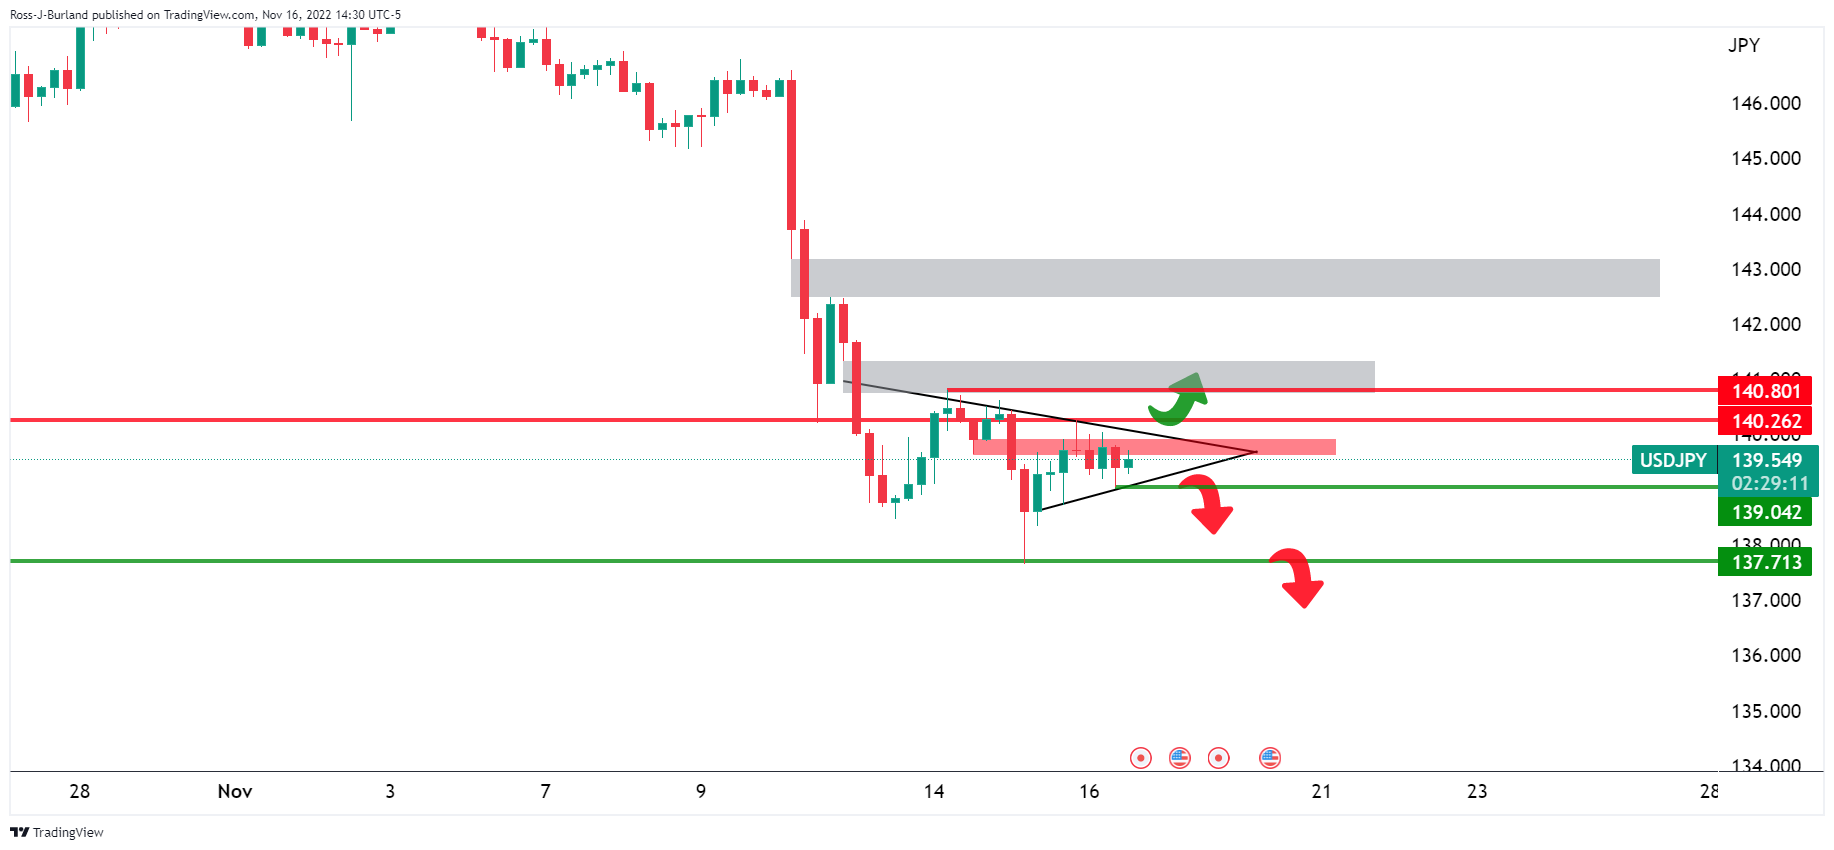
If we enlarge the graph, we will see it more clearly.
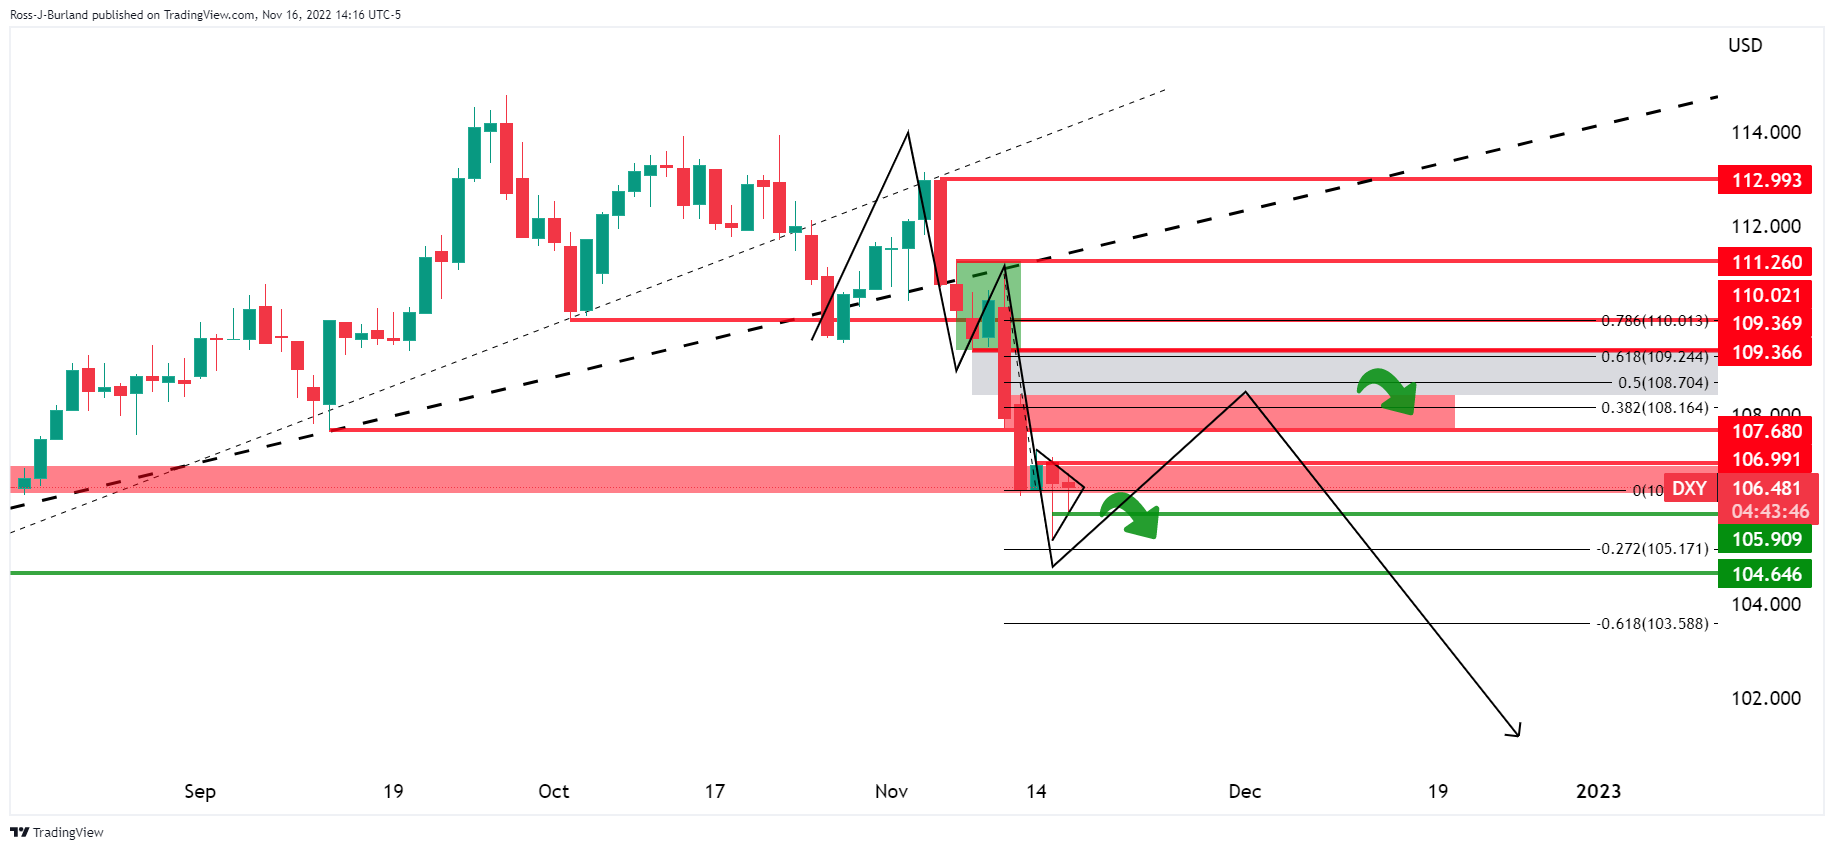
DXY daily chart
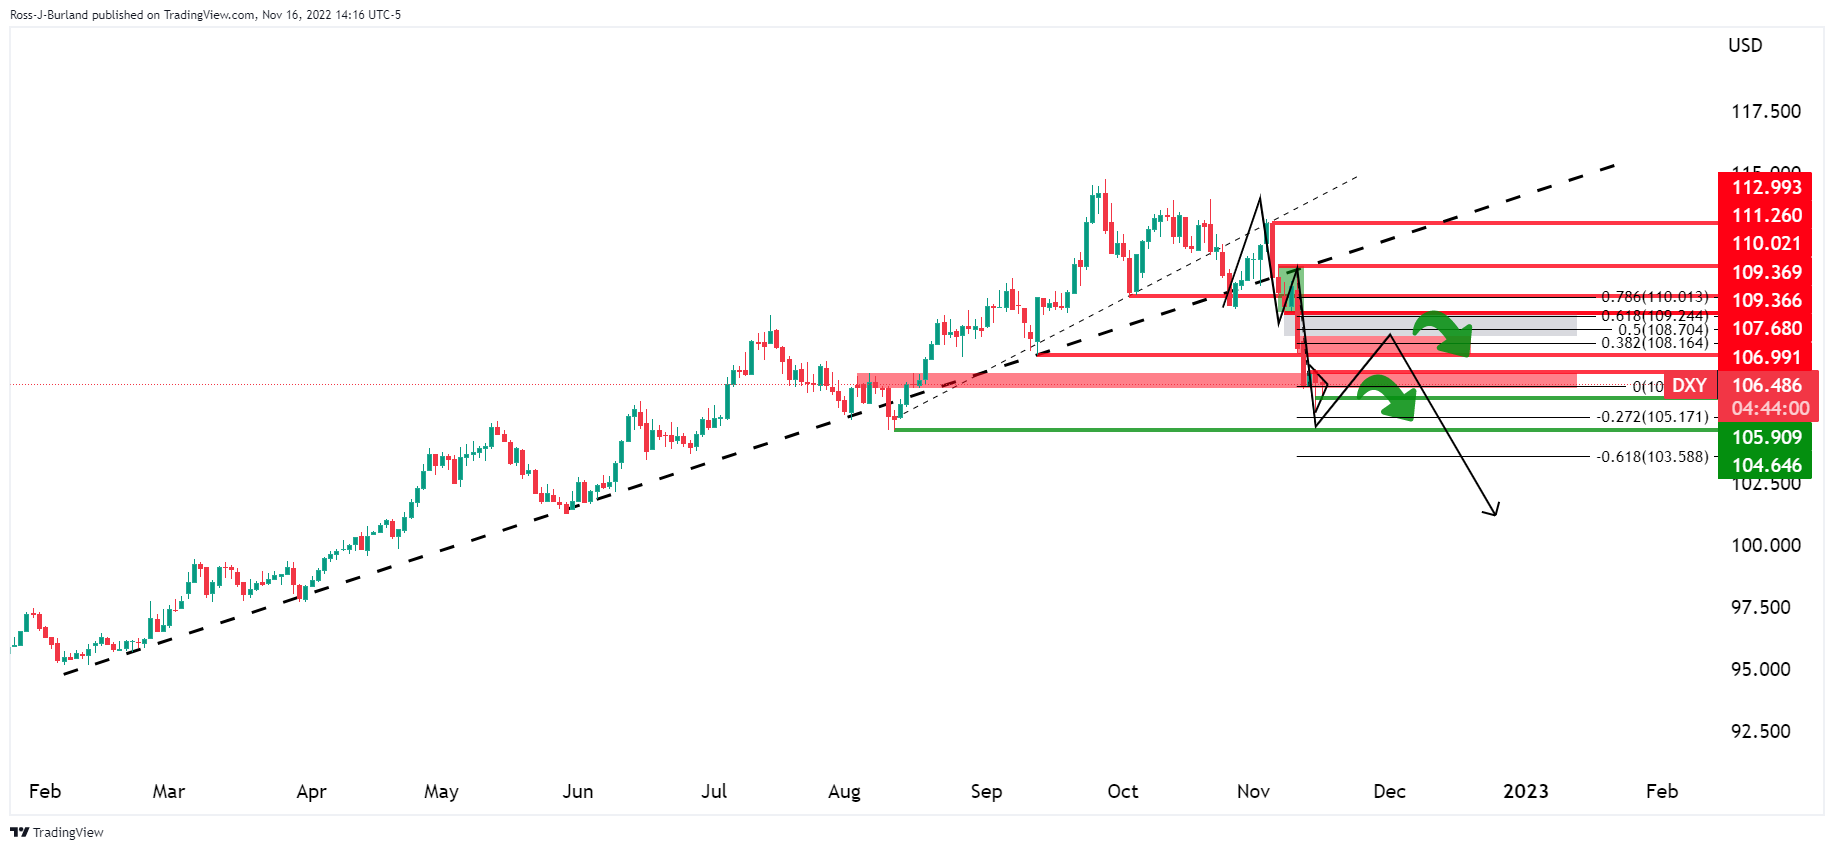
The dollar is also rolled up and bearish while below resistance. On the other hand, the M formation is bullish, so the price is expected to head towards the neckline again, at least to test the 38.2% Fibonacci level.
Source: Fx Street
I am Joshua Winder, a senior-level journalist and editor at World Stock Market. I specialize in covering news related to the stock market and economic trends. With more than 8 years of experience in this field, I have become an expert in financial reporting.


