
- USDJPY fell below the 100 day EMA and bottomed around 137.65.
- USDJPY has been building a bottom around the 137.60-140.80 zone for the last five days in a row.
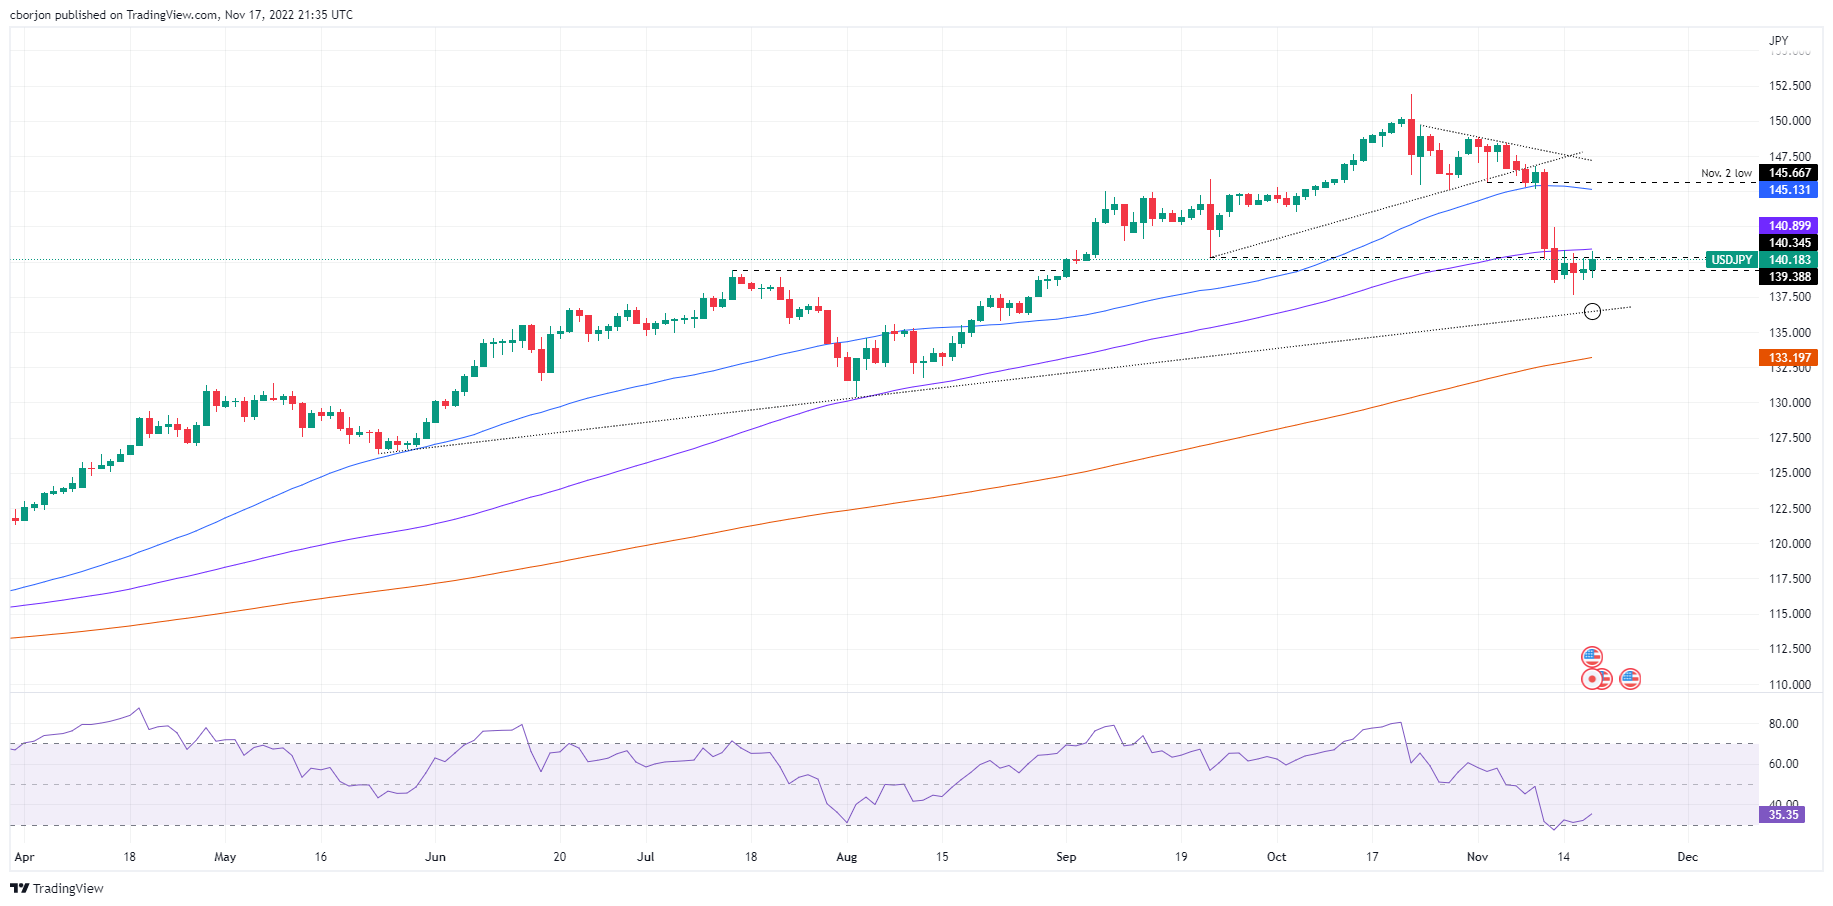
- The Relative Strength Index coming out of oversold conditions suggests a probable upward correction.
The USDJPY consolidated below the 100-day EMA, after falling from October highs of 151.94. Even so, since then, the US dollar (USD) has depreciated nearly 8% against the Japanese yen (JPY) in nearly a month. At the time of writing, the USDJPY is trading at 140.15, up 0.49% from the opening price, after hitting a daily low of 138.87.
USDJPY Price Analysis: Technical Perspective
For the week, the USDJPY remains trapped in a tight range of 137.50-140.80 so far, after dipping towards a fresh three-month low around 137.65, hit on November 15, formed a hammer. Since then, the USDJPY posted two successful days with no lows below 138.70 and rallied towards the 100-day EMA at 140.89. However, unless USD buyers pick up on the latter, the main bias would remain neutral to the downside.
That being said, the first support for USDJPY would be the 16th November daily low at 138.72. A break of the latter would expose key support levels such as the weekly low at 137.65. Once broken, the next support would be a three-month uptrend line through 137.48, immediately followed by the 200 day EMA.
On the other hand, the first resistance for the USDJPY would be the 100-day EMA at 140.89. A break above will expose the November 11 daily high at 142.48, followed by the 50 day EMA at 145.13.
Key USDJPY Technical Levels
Source: Fx Street
I am Joshua Winder, a senior-level journalist and editor at World Stock Market. I specialize in covering news related to the stock market and economic trends. With more than 8 years of experience in this field, I have become an expert in financial reporting.


