
- USDJPY is set to end the week with gains of over 1%.
- Despite the USDJPY falling towards 137.50, the bias remains bullish.
- USDJPY Price Analysis: Break below 137.50, a drop to the 200 DMA is on the cards; otherwise, the 100 DMA is in the offing.
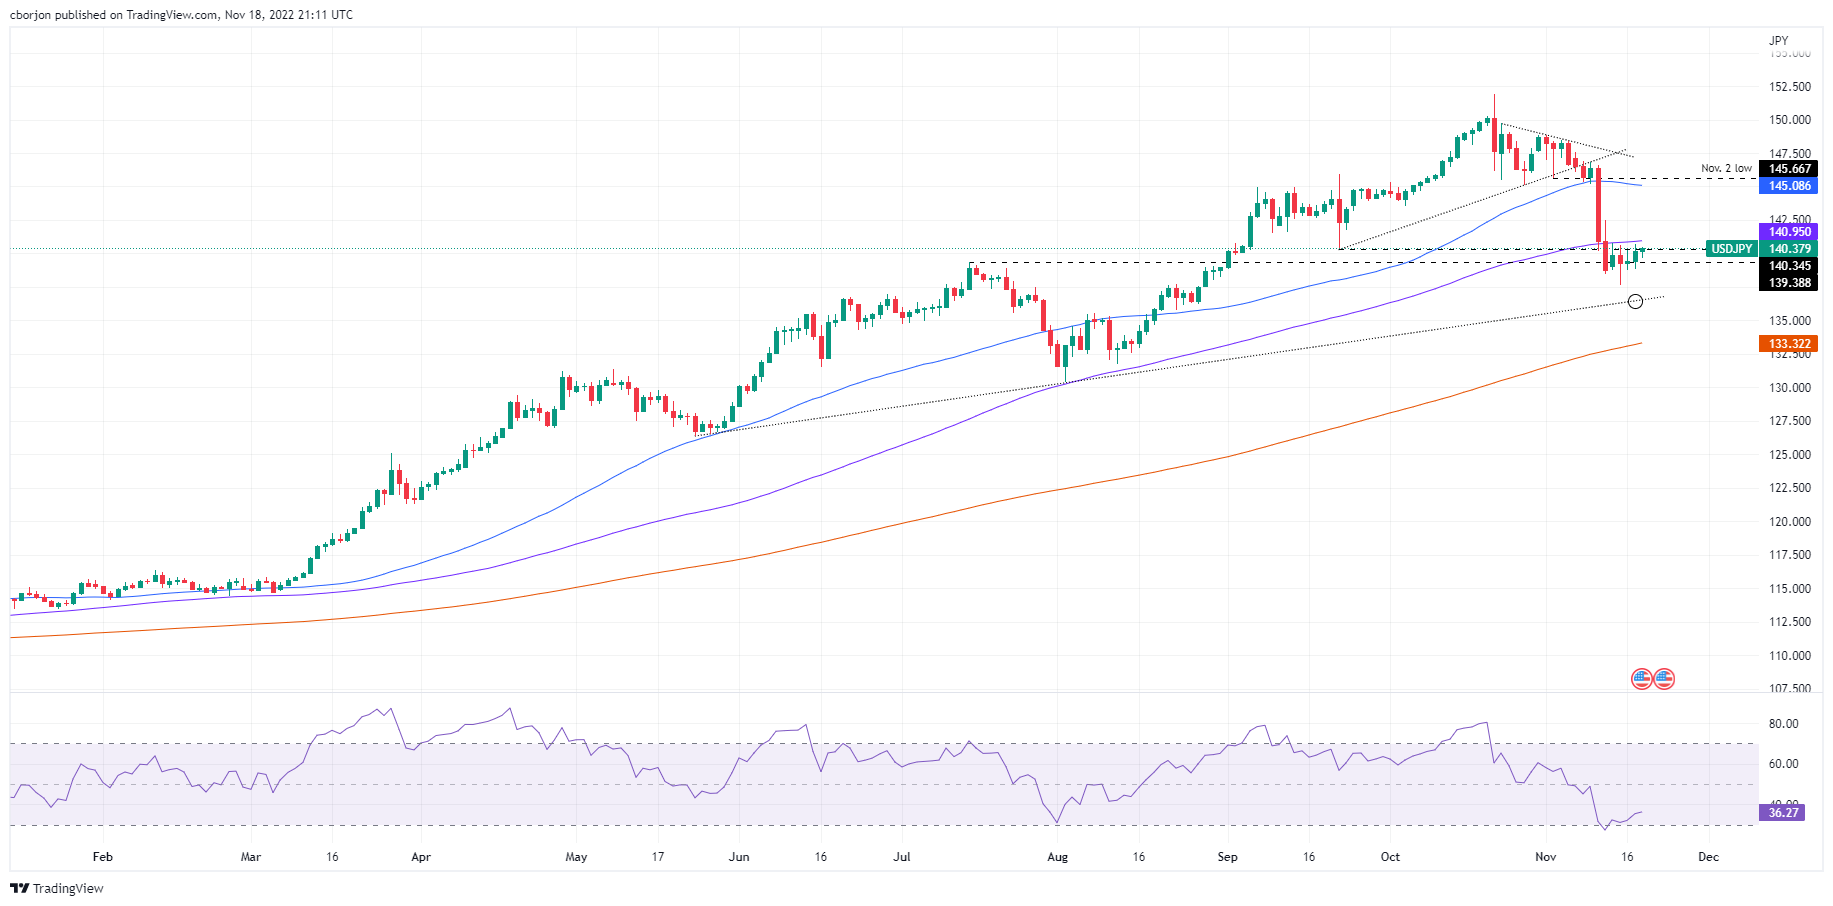
The USDJPY will end the week almost flat, falling in the last week from around 147.00 to 138.46, after the release of a soft inflation report in the United States (US), sparking speculation that the Federal Reserve (Fed ) could stop raising rates. However, this week, the USDJPY is recovering. At the time of writing, the USDJPY is trading at 140.37.
USDJPY Price Analysis: Technical Perspective
Despite having fallen in the last week close to 5%, the USDJPY continues to have a bullish bias. At the time of writing, the USDJPY is comfortably above 140.00. However, the USDJPY was unable to break the 100-day EMA at 140.95, which could have exacerbated a rally towards the November 11 daily high of 142.48. Notably, the Relative Strength Index (RSI) broke out of oversold territory, suggesting that USDJPY buyers are outperforming sellers.
On the downside, key USDJPY support levels are the September 22 low at 140.34, followed by this week’s low on November 15 at 137.65. To the upside, key USDJPY resistance levels sit at the 100 day EMA at 140.95, followed by 142.48 and the 50 day EMA at 145.08.
,
Key USDJPY Technical Levels
Source: Fx Street
I am Joshua Winder, a senior-level journalist and editor at World Stock Market. I specialize in covering news related to the stock market and economic trends. With more than 8 years of experience in this field, I have become an expert in financial reporting.


