What is Parabolic Sar
Parabolic SAR or, initially, just SAP (Stop and Reverse) is an indicator that is designed to determine the levels on cryptocurrency graphics, the breakdown of which signals a trend change. In addition to your original English -language name, you can also find a Russian -speaking analogue – “Paraboxic Price/Time” system or simply “Paraboral”.
Who invented it?
Indicator developer
The first references to Parabolic Sar
appeared In the book of an American engineer and technical analyst John Wells Wilder Jr., New Concepts in Technical Tradition Systems in 1978, John Wilder Jr.. Since then, the indicator began to be used on trading floors around the world. It is worth noting that Wilder’s work is not limited to one Parabolic SAR. He also developed an indicator such as RSI.
How to get a Parabolic SAR mathematically?
How Parabolic Sar is calculated
The calculation of the indicator will consist of two formulas: one is designed for a bull (ascending) trend, and the second for bear (descending). At the same time, they will not differ very much. For the rising trend, the Parabolic SAR is calculated as follows:
SAR(n+1) = SAR(n) + α*(High – Sar(n))
where sar (n+1) is the value of the indicator of the future period;
SAR(n) – the current value of Parabolic SAR;
α – acceleration factor;
High is the maximum price between the current time of time and the previous indicator.
Separately, it is worth touching the acceleration factor. It is determined by three parameters: the minimum and maximum value, as well as a step. They are standard for α 0.02, 0.2 and 0.02 – for a step.
For the descending trend, the Parabolic SAR is calculated as follows:
SAR(n+1) = SAR(n) – α*(Sar(n) – Low)
Where LOW is the minimum price for the period between the current moment of time and the previous indicator.
Naturally, in modern cryptocurrency trading services and other assets, the Parabolic SAR calculation is automatically made, and you can’t do any independent actions manually.
And how to apply an indicator in practice?
Practical application Parabolic Sar
Parabolic SAR is largely reminiscent of ordinary sliding medium. Only his graphic representation can be different.
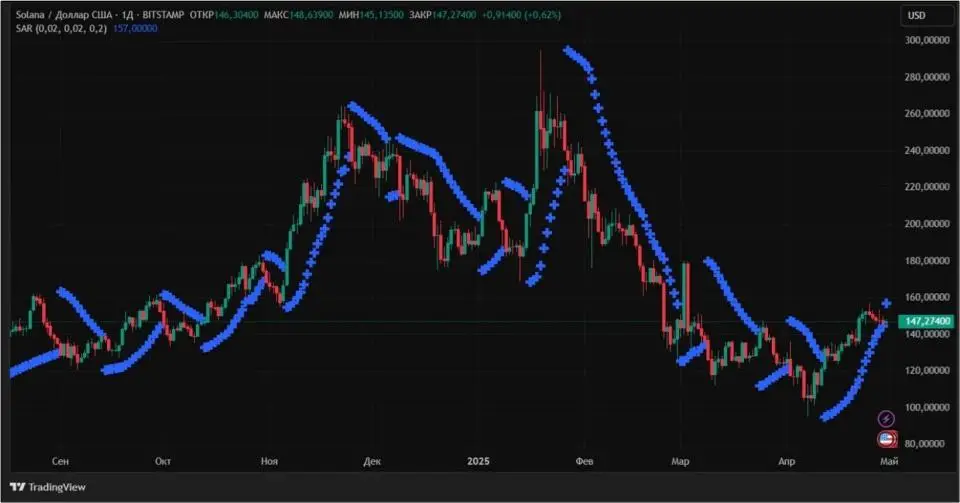
It can be made in the form of points or crosses:

Source: TradingView.com
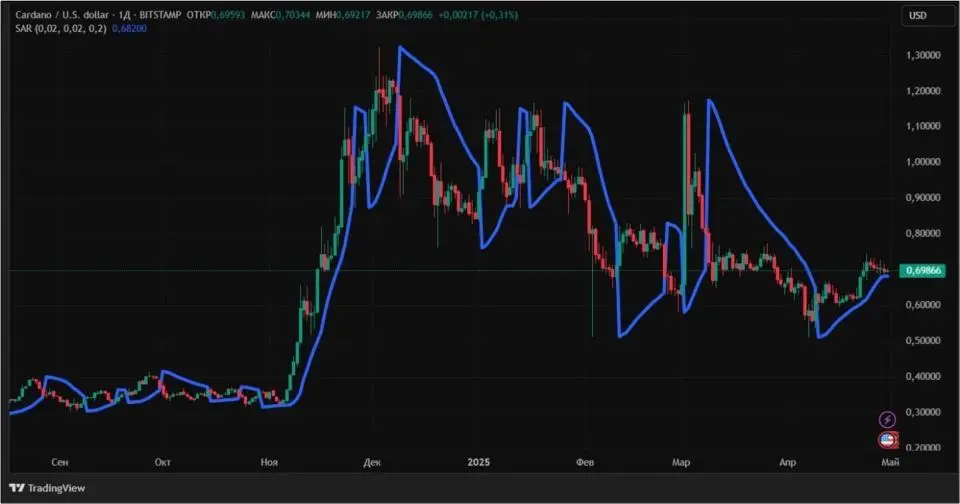
You can also find an option made using classic lines. Here it is on the day schedule of Cardano:

Source: TradingView.com
In any case, the interpretation of the Parabolic SAR will be unequivocal. If the indicator is below the price of cryptocurrency, then a bull trend was formed on the market. In the opposite case – bear. At the time of intersections at the cost of the indicator, the traders have the opportunity to enter the deal or get out of it.
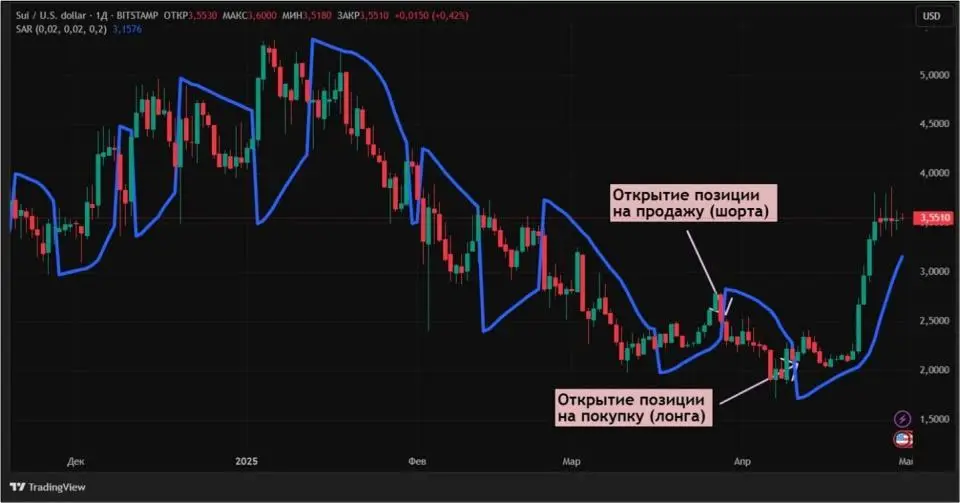
For clarity, consider an example. Take the daily schedule of SUI and apply Parabolic Sar to it. The indicator will be indicated by a blue line. Consider the situation that took shape on the schedule from late March to April 2025. On March 29, the indicator rose above the price, which became the reason for opening short positions. April 11th took place. On this day, the price rose above Parabolic Sar, which announced the beginning of the bull trend, which continues to this day:

Source: TradingView.com
It is worth noting that the indicator will work better during a strong trend without sharp price kickbacks. But during a high volatility on a short period of time, Parabolic Sar can bring fairly sensitive losses.
To increase the effectiveness of the indicator, it can be used along with other analytical tools. They can be supporting and resistance levels, sliding medium or oscillators.
Like any indicator, Parabolic Sar has its strengths and weaknesses.
Parabolic Sar pros and cons of
The main advantage of the parabolic system is simplicity and visualization. Any, even a novice trader will always be able to decide for himself where the trend will change – just looking at the schedule. The pluses of Parabolic SAR include the fact that with its help it is enough to simply set the stop applications to limit losses.
There is only one minus of the indicator – it works poorly with the side movement, as it gives a lot of false signals. The same applies to very volatile tools.
Conclusion
Parabolic SAR is a tool with which traders determine the moment of the end of the bull or bear trend on the crypto. It can be used both separately and along with other indicators of technical analysis. The latter option is more reliable compared to the first.
This material and information in it is not an individual or other other investment recommendation. The view of the editorial office may not coincide with the opinions of analytical portals and experts.
Source: Bits
I am an experienced journalist, writer, and editor with a passion for finance and business news. I have been working in the journalism field for over 6 years, covering a variety of topics from finance to technology. As an author at World Stock Market, I specialize in finance business-related topics.


