
Although Bitcoin lasts just above $ 108,000, all the attention of the market is focused on $ 110,000. Last week, BTC tried to achieve this goal, and now he has every chance of success.
We figure out what is happening in the Bitcoin market (BTC) and what to expect from the price of cryptocurrency.
BTC reserves are reduced
The most obvious bull indicator is the speed of reduction in bitcoin reserves on exchanges. On the seventh of July, only 2.4 million BTC remained on centralized platforms – this is at least three years.
Historically, a decrease in stocks on exchanges indicates that investors bring coins into cold wallets and thereby reduce sales pressure. This situation often precedes significant jumps in prices, since the proposal is reduced, and any sudden surge of demand leaves little time for the reaction of sellers.
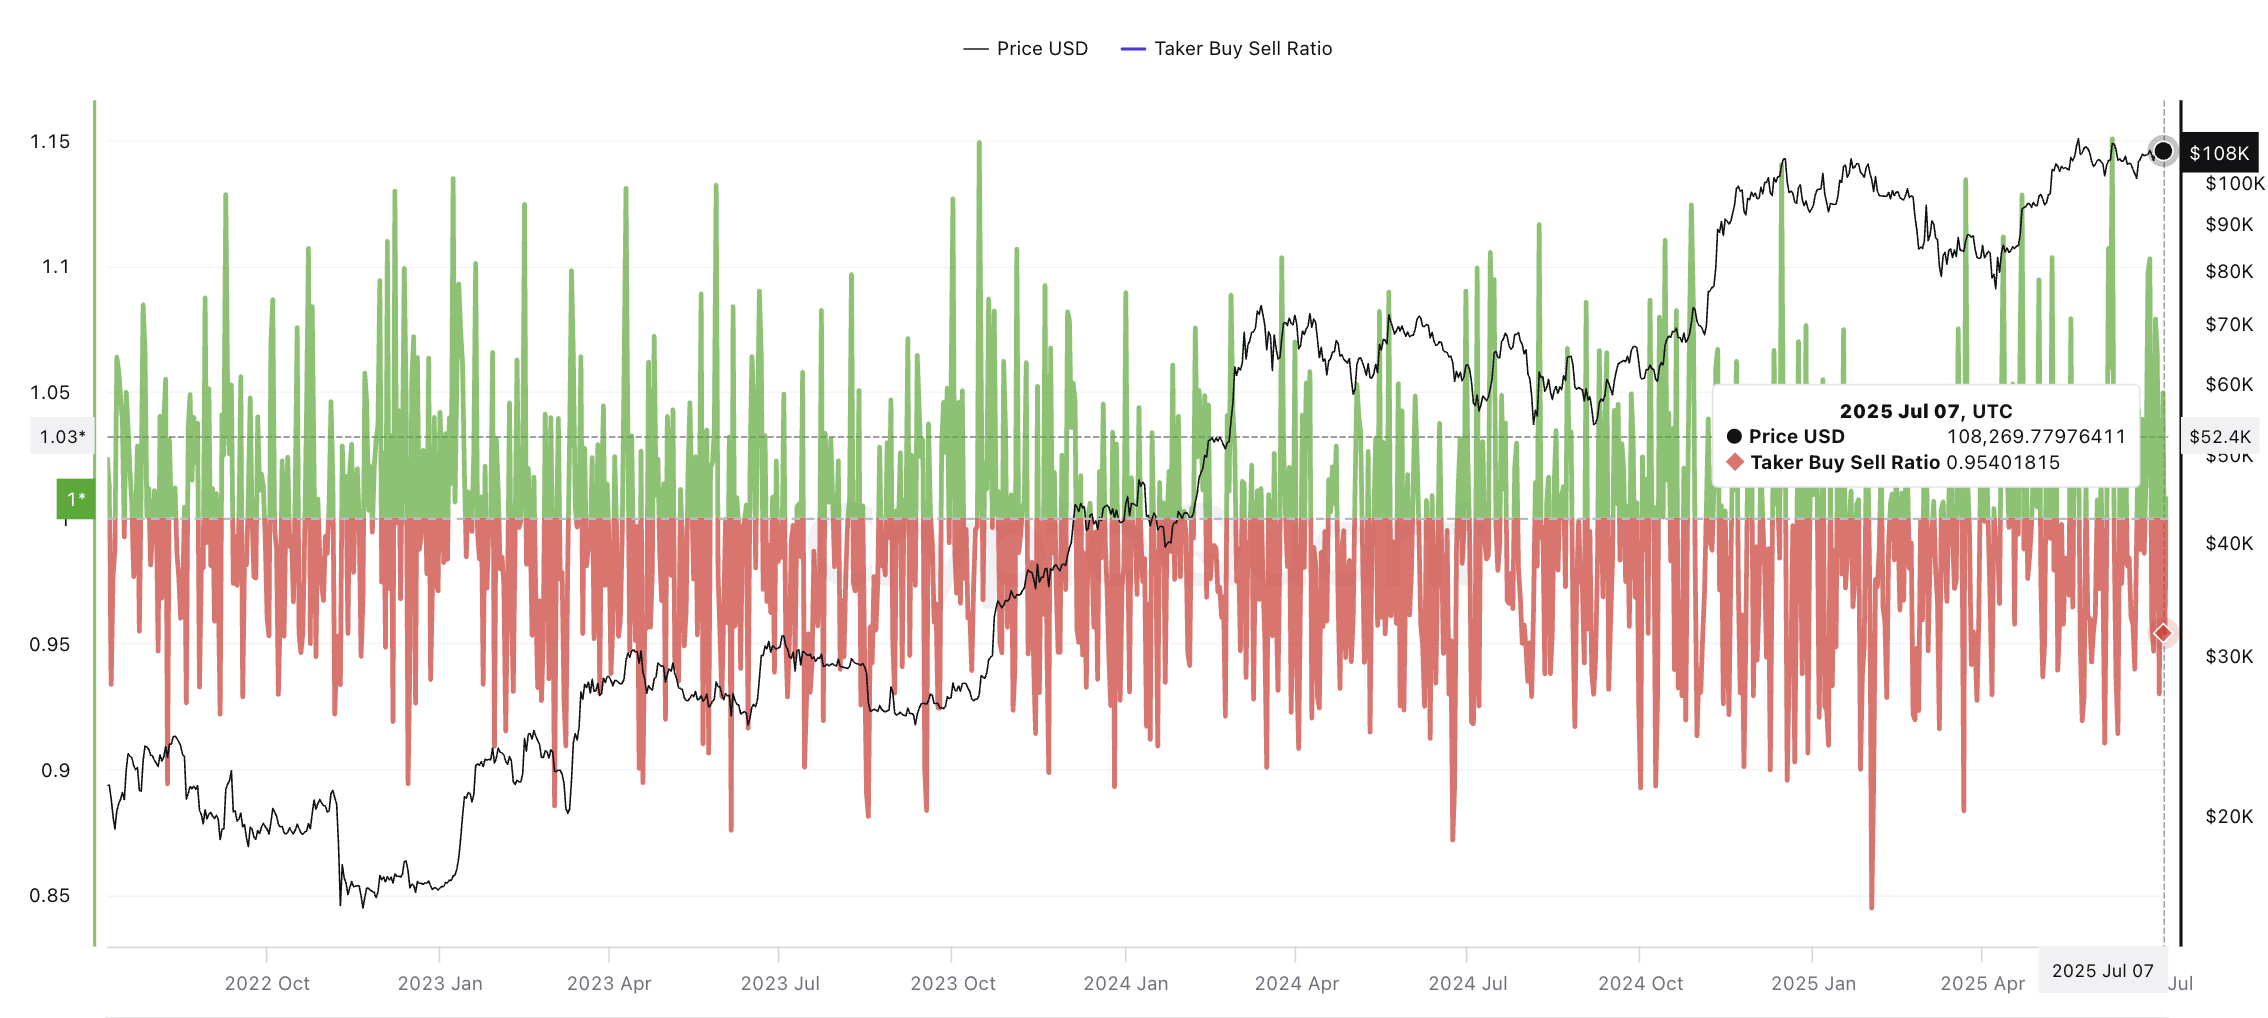
One of the key indicators that you should follow is the ratio of purchases and sales. At the time of publication, the indicator is 0.95, which indicates a small advantage of sellers. If in the coming days the indicator grows, this can be the last impetus to overcome the level of $ 110,000.
The IN/Out of the Money Around Price (IOMAP) indicator shows at what price levels of wallet owners bought bitcoin, and where the highest pressure on the purchase and sale may occur. Closers of wallets, which are now profitable, form support zones; Those who are in a loss create resistance.
According to the latest IOMAP data, 94.61% of all BTC addresses are now profitable. This creates a significant airbag, as high profitability reduces the pressure on the sale – holders are in no hurry to sell. The data also indicate a strong support zone between $ 107 209 and $ 110 041, where many wallets purchased BTC.
The resistance zone between $ 110 042 and $ 110,624 is weak. There are few wallets, which means a minimum offer that can stop growth if the BTC overcomes a mark of $ 110 thousand. This combination of strong support and weak resistance creates a potential for sharp growth if the pulse returned.
Bitcoin price levels coincide with canchain-signals
The Fibonacci correction schedule and horizontal resistance lines confirm onchain-metrics: Bitcoin is close to the breakthrough zone. At the time of writing, the BTC is traded at $ 108 235, slightly higher than the level of 0.236 Fibonacci correction. The key levels of resistance for bitcoin are $ 110 583 and $ 110 779.
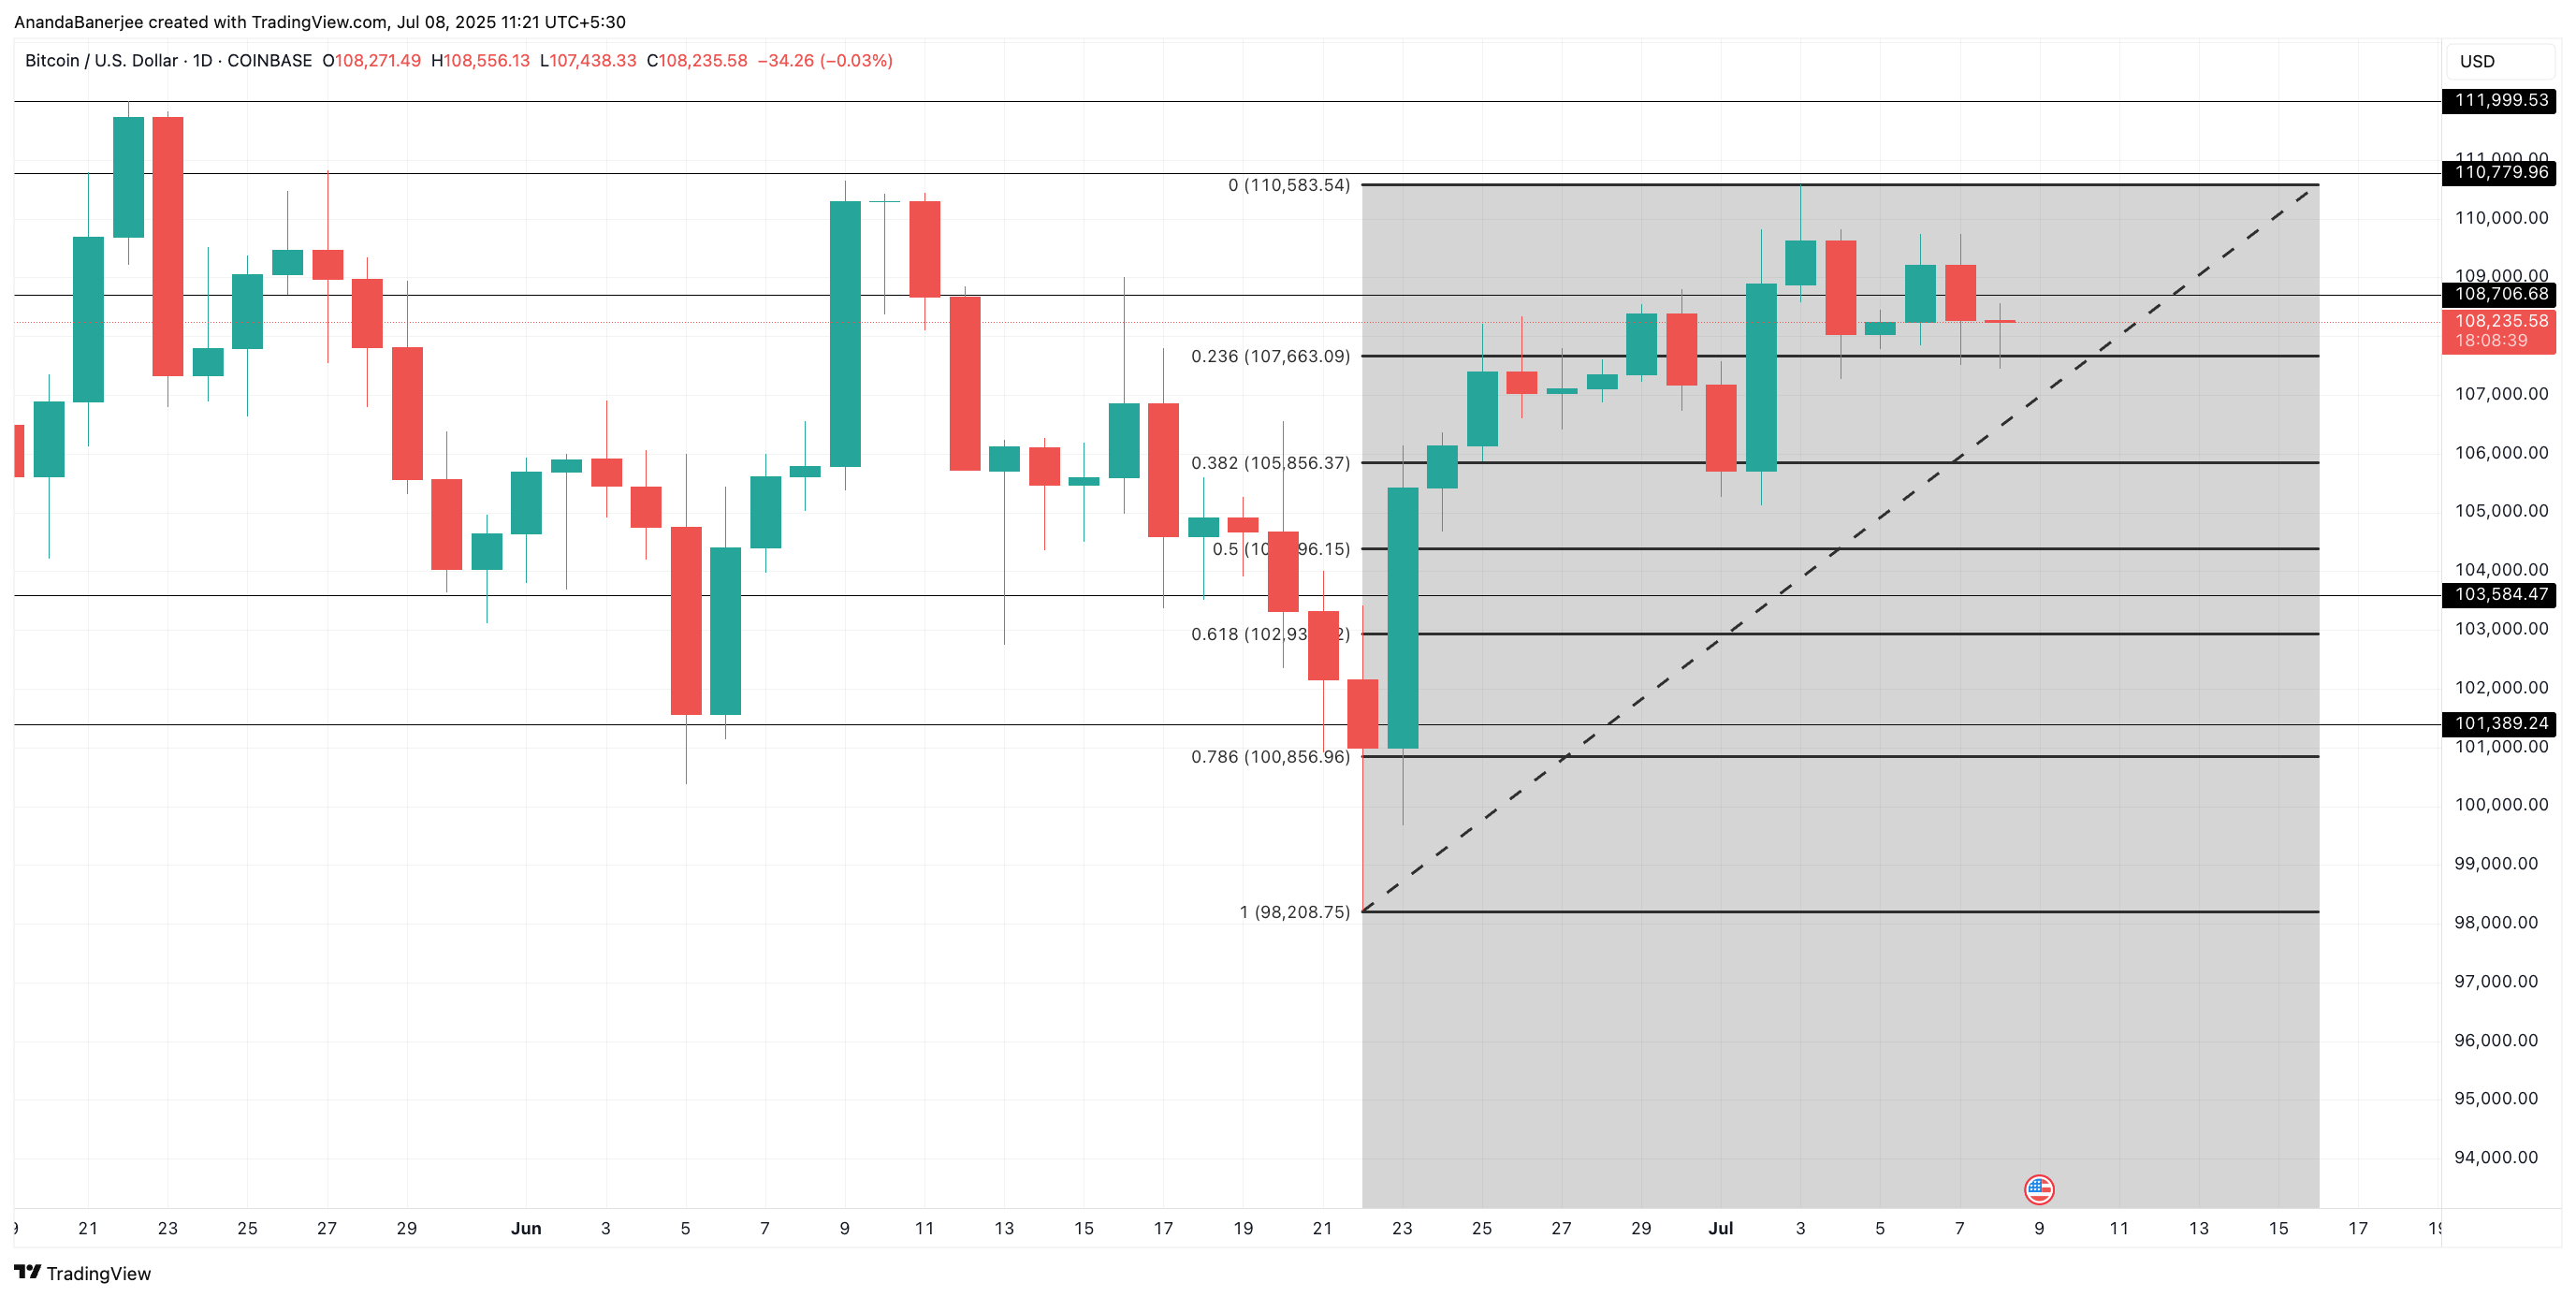
If Bitcoin does not keep support in the $ 107 209 range – $ 110 041 and drops below $ 103,584, then the next level will be $ 101,389. If the price of bitcoin breaks out $ 110,000, he will get a chance to return to ATH for $ 111,970 and probably go higher.
Be in the know! Subscribe to Telegram.
Source: Cryptocurrency
I am an experienced journalist and writer with a career in the news industry. My focus is on covering Top News stories for World Stock Market, where I provide comprehensive analysis and commentary on markets around the world. I have expertise in writing both long-form articles and shorter pieces that deliver timely, relevant updates to readers.


