
- Despite dipping below $76.00, WTI rallied and pared previous losses to 0.51%.
- Saudi officials denied the news that OPEC was considering increasing oil production.
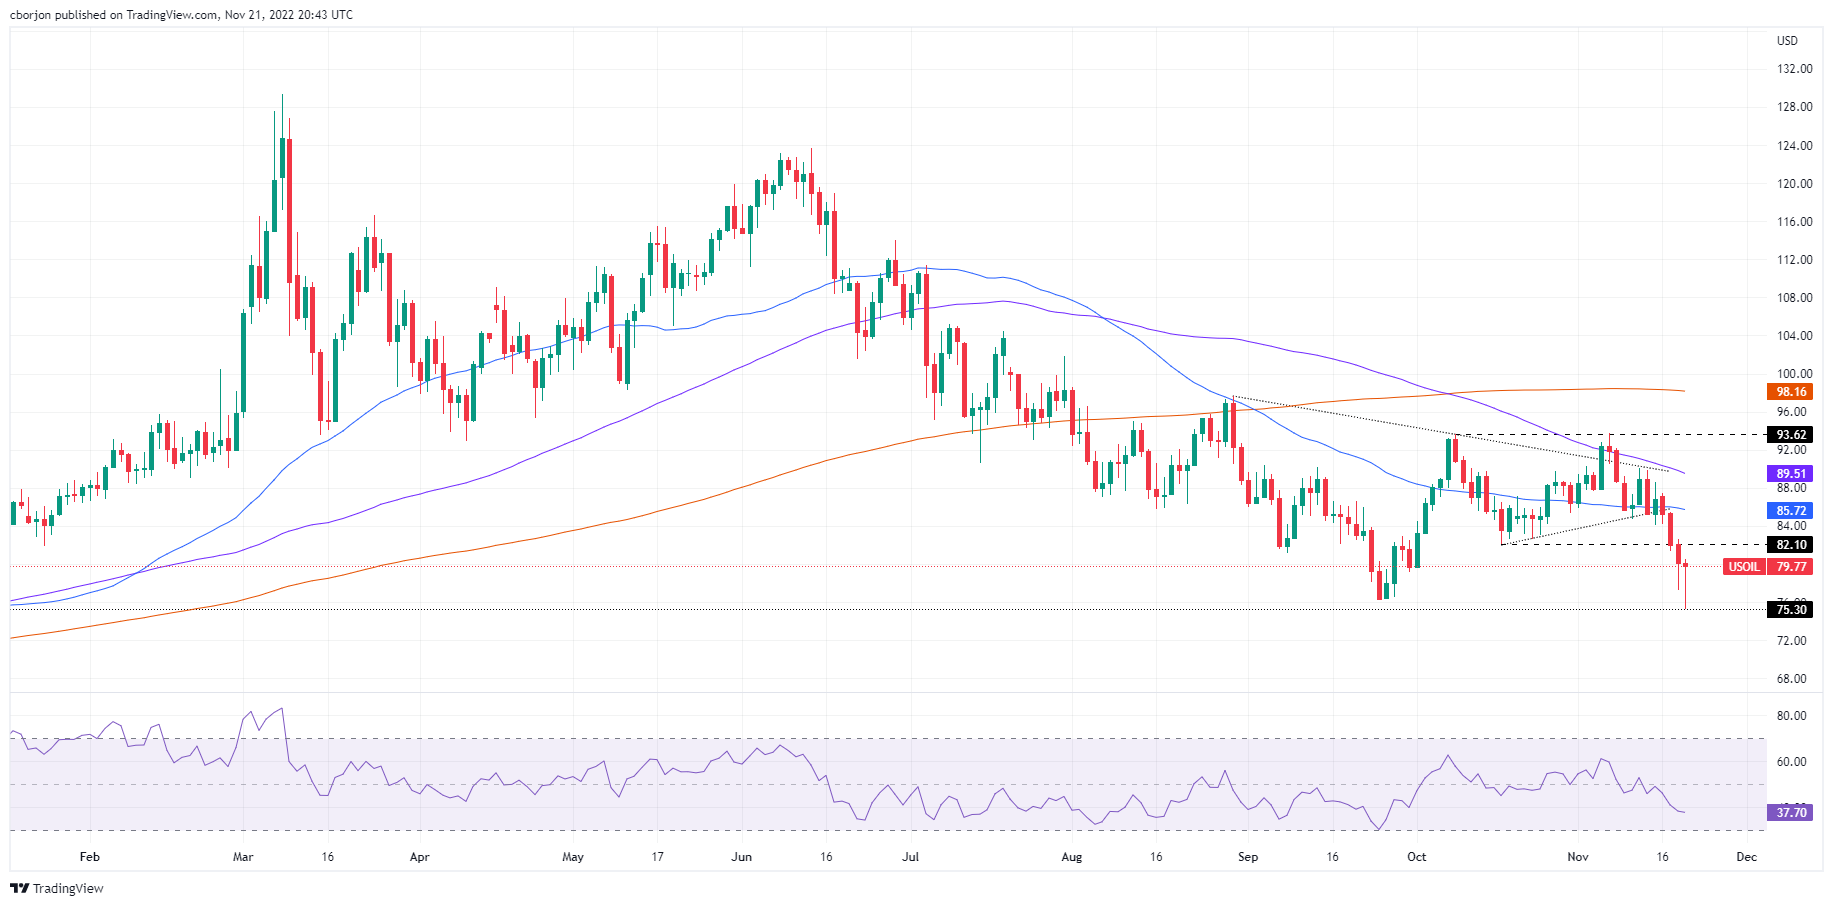
- WTI Price Analysis: A candle hammer on the daily chart may push oil prices higher.
Western Texas Intermediate (WTI) remains in negative territory during the North American session after hitting a daily low of $75.30 per barrel on rumors that the Organization of the Petroleum Exporting Countries (OPEC) was considering an increase in its oil production, as reported by the Wall Street Journal (WSJ). Another factor weighing on crude oil demand was the Covid-19 outbreak in China, which has caused three deaths in the past week, raising speculation that China’s need for oil will decline. Therefore, the WTI operates at $79.88 per barrel.
According to OPEC delegates quoted by the WSJ, Saudi Arabia considered boosting crude oil production by 500,000 barrels in light of the embargo imposed on Russian oil. Once the headline crossed the wires, WTI plunged 3.6% in value, plunging towards its daily low of $75.30, before regaining some ground as Saudi Energy Minister Prince Abdulaziz bin Salman denied those claims
Prince Abdulaziz bin Salman said that “if there is a need to take further measures by reducing production to balance supply and demand, we are always ready to intervene.”
Separately, Covid-19 cases in China are rising to levels last seen in April 2022, according to Goldman Sachs. Sentiment has soured on fears Chinese authorities will re-impose lockdowns, which could slow the global economy and dent demand for crude oil.
Oil traders should note that OPEC and its allies (OPEC+) will meet on December 4 to lay the groundwork for January 2023, one day before the Russian oil embargo and oil price cap begin. of the G7.
WTI Price Analysis: Technical Perspective
The WTI daily chart suggests that oil prices missed the 2022 low around $74.30 PB and are staging a comeback, near $80.00 PB. In particular, the price action on Monday formed a huge hammer candle, which suggests that WTI could rally in the short term, but buyers need to recapture $80.00 first.
If this scenario plays out, the first resistance for WTI would be the October 18 low turned resistance at $82.10, followed by the 50-day EMA at $85.72 and the 100-day EMA at $89.51. On the other hand, key support levels for WTI are the September 26 daily low at $76.28, the November 21 swing low at $75.30 and the year-on-year low at $74.30.
Source: Fx Street
I am Joshua Winder, a senior-level journalist and editor at World Stock Market. I specialize in covering news related to the stock market and economic trends. With more than 8 years of experience in this field, I have become an expert in financial reporting.


