
- Following an arbitration decision between Kurdistan and Baghdad, supply risks halted 450,000 barrels of exports through Turkey.
- A weak dollar underpins benchmark US crude oil prices.
- WTI shows a neutral bias to the downside, but oscillators turned bullish, suggesting further gains.
Western Texas Intermediate (WTI), the benchmark for US crude oil, rises in the middle of the North American session, spurred on by crude supply problems. In addition, a boost in risk appetite weakened safe-haven assets, such as the dollar. At the time of writing these lines, WTI is trading at $73.55 a barrel.
WTI jumped $3 after exports of 450,000 barrels from Iraq’s Kurdistan region via Turkey were halted, spurred by an arbitration ruling that Baghdad’s approval was required to transport the oil.
Meanwhile, sentiment changed after First Citizens BancShares acquired Silicon Valley Bank’s (SVB) deposits and loans. This fueled a rally in bank holdings around the world as the crisis in the banking system abated.
Therefore, safe haven assets such as the US dollar (USD) fall across the board. The Dollar Index (DXY) falls 0.38% to 102.449. A weaker dollar makes oil cheaper for international buyers and drives up the price of WTI.
Russian President Vladimir Putin’s announcement to deploy tactical nuclear weapons in Belarus to intimidate the West pushed up oil prices because of its support for Ukraine. NATO called Putin’s comments “dangerous and irresponsible”.
At the same time, Russian Deputy Prime Minister Alexander Novak commented that Moscow is close to reaching 500,000 crude production, down to about 9.5 million bpd.
WTI Technical Analysis
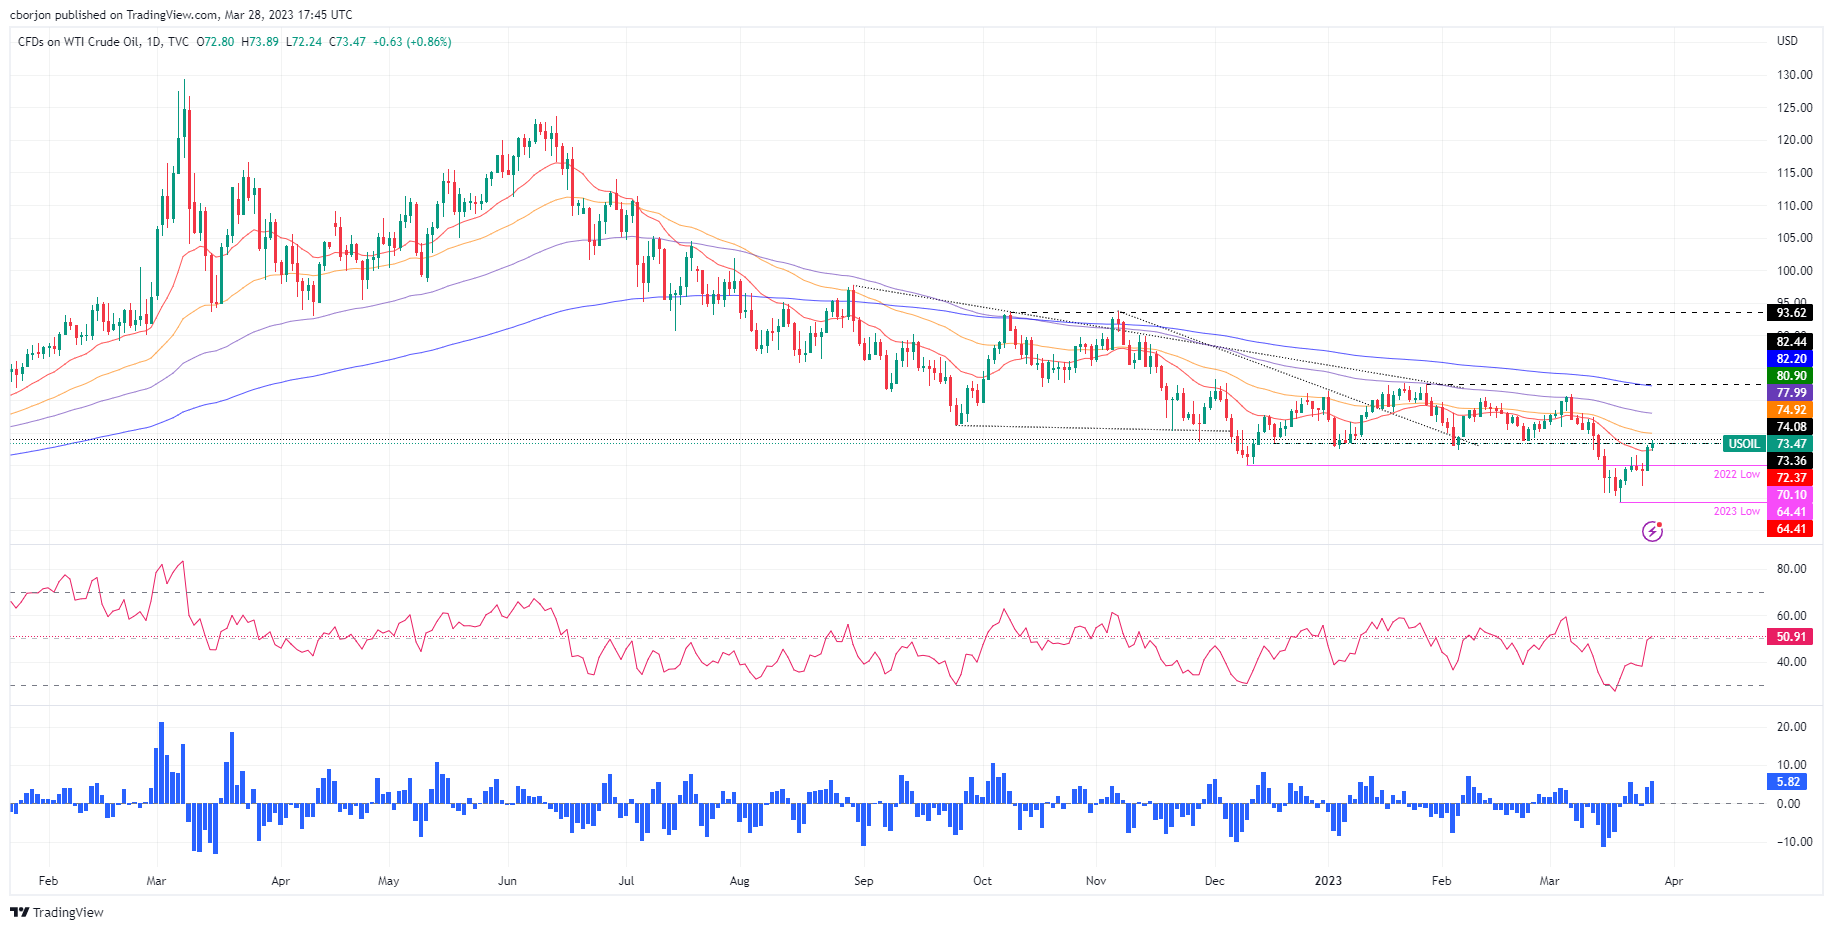
WTI remains biased from neutral to bearish, although it has broken above the 20 day EMA. Oscillators turned bullish, with the Relative Strength Index (RSI) above 50, which could pave the way for further gains. That being said, WTI could rally to $80.00. Therefore, the first resistance for WTI would be the 50-day EMA at $74.93, followed by the 100-day EMA at $78.06, before testing $80.00.
Source: Fx Street
I am Joshua Winder, a senior-level journalist and editor at World Stock Market. I specialize in covering news related to the stock market and economic trends. With more than 8 years of experience in this field, I have become an expert in financial reporting.


