- WTI falls as the US dollar continues to be buoyed by expectations of a Fed rate hike.
- The 600,000 barrel increase from the US EIA had no impact on the WTI price.
- WTI Price Analysis: Downside risks remain below $80.00; otherwise, oil prices will remain sideways.
He Western Texas Intermediate (WTI), the benchmark for US Crude Oil, falls as the US dollar (USD) strengthens on speculation that the Fed will raise rates as it tries to tackle sticky inflation. Thus, the WTI is trading at $79.65 PB, with a decrease of more than 1.50%.
The dollar continued trading higher during the New York session. Hawkish comments from the Federal Reserve on Tuesday caused US Treasury yields to rise, propping up the dollar. Market Participants preparing for a 25 basis point rate hike from the Fed led the USD higher, as shown by the Dollar Index which gained 0.22% to 101.942.
CME’s FedWatch tool shows a hike probabilities towards the 5.00%-5.25% threshold of 85.4% for the May Fed meeting.
Consequently, the yield on the 2-year US Treasury bond, the most sensitive to short-term interest rate adjustments, has risen six and a half points to 4,267%, increasing demand for dollars , thus making dollar-denominated commodities more expensive for foreign buyers.
Another reason for the oil slide was the latest report from the US Energy Information Administration. The data revealed an inventory draw of 4.6 million barrels for April 14, a modest increase of 600,000 barrels from 3.7 million last week.
On the other hand, China, the world’s largest importer of crude oil, reported mixed economic data, signaling a challenging economic recovery after the country abandoned its COVID-19 policy.
WTI Technical Analysis

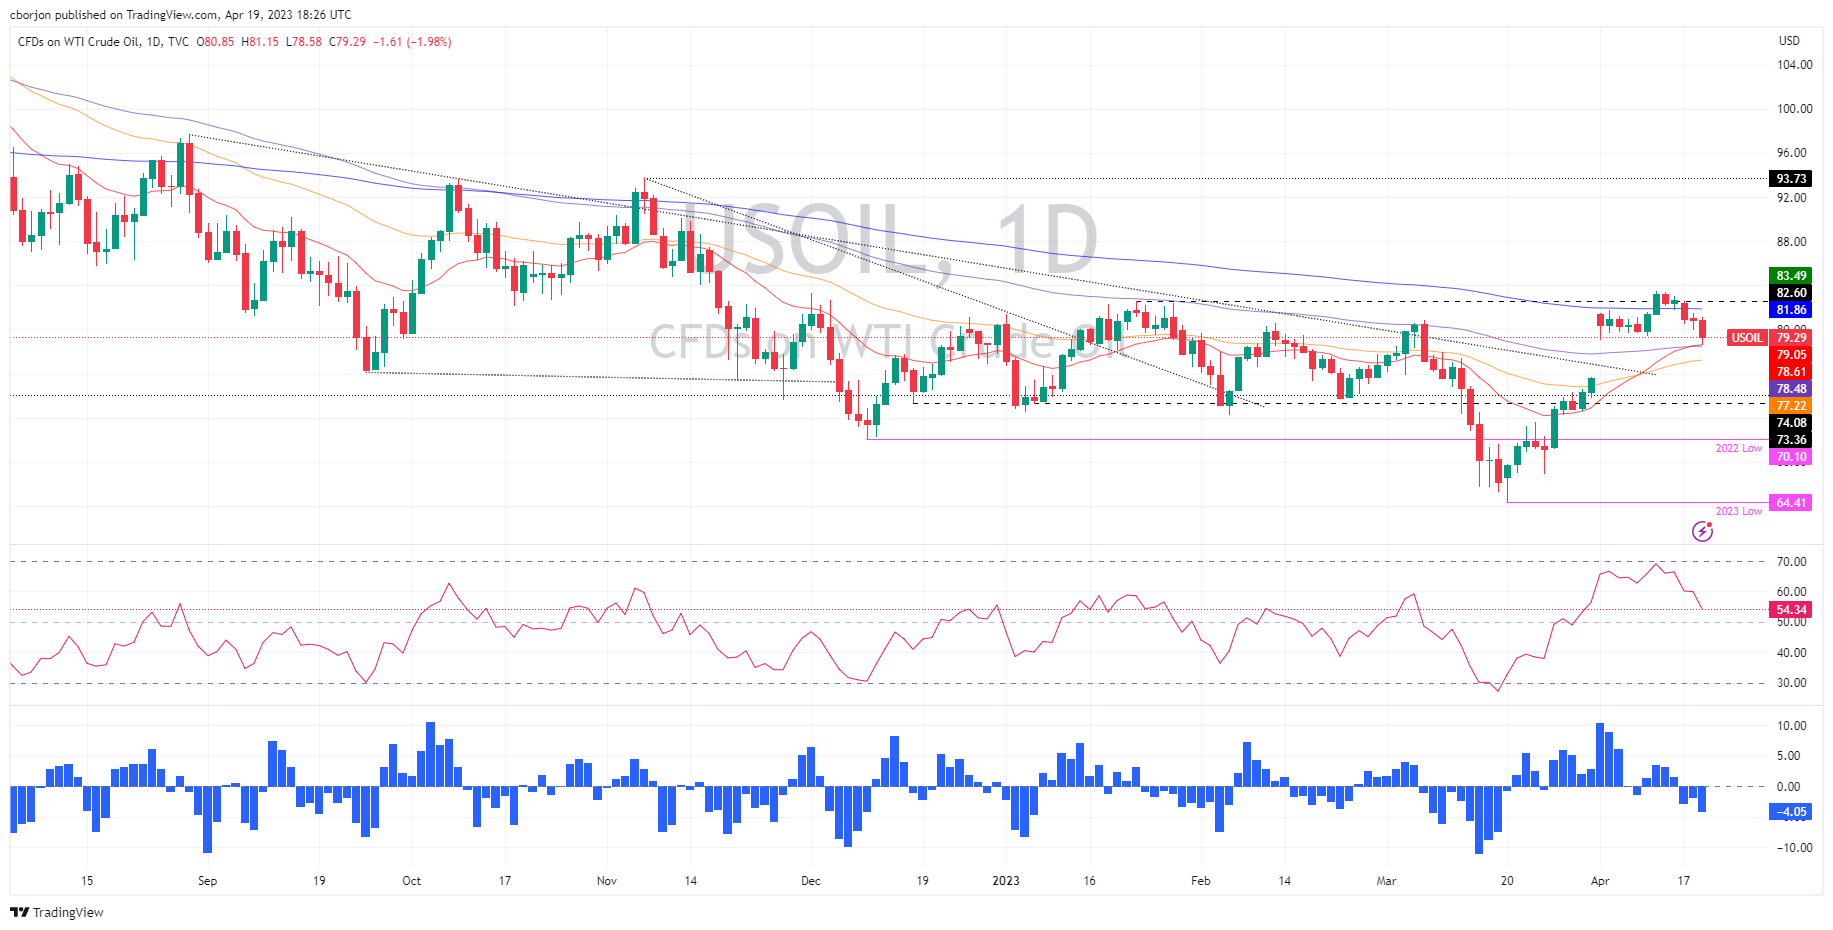
WTI maintains a neutral to the downside bias after paring some of the gains generated by OPEC’s announcement to cut its crude oil production by 1 million barrels in early April. Furthermore, WTI dipped below the 200 day EMA at $81.86, exacerbating a decline below the $80.00 BP barrier. For a bearish continuation, WTI must break above $79.00. Once this is done, the next demand zone would be the confluence of the 20 and 100 days, around $78.48/$62, followed by the $78.00 barrier. Conversely, WTI could continue to trade sideways if the bulls recapture $80.00.
WTI US OIL
| Overview | |
|---|---|
| Last price today | 79.36 |
| daily change today | -1.53 |
| today’s daily variation | -1.89 |
| today’s daily opening | 80.89 |
| Trends | |
|---|---|
| daily SMA20 | 77.07 |
| daily SMA50 | 76.41 |
| daily SMA100 | 77.01 |
| daily SMA200 | 82.39 |
| levels | |
|---|---|
| previous daily high | 81.51 |
| previous daily low | 79.91 |
| Previous Weekly High | 83.4 |
| previous weekly low | 79.4 |
| Previous Monthly High | 80.99 |
| Previous monthly minimum | 64.39 |
| Fibonacci daily 38.2 | 80.52 |
| Fibonacci 61.8% daily | 80.9 |
| Daily Pivot Point S1 | 80.03 |
| Daily Pivot Point S2 | 79.17 |
| Daily Pivot Point S3 | 78.43 |
| Daily Pivot Point R1 | 81.63 |
| Daily Pivot Point R2 | 82.37 |
| Daily Pivot Point R3 | 83.23 |
Source: Fx Street
I am Joshua Winder, a senior-level journalist and editor at World Stock Market. I specialize in covering news related to the stock market and economic trends. With more than 8 years of experience in this field, I have become an expert in financial reporting.


