
- Speculation about further Federal Reserve tightening props up the dollar, a headwind for oil prices.
- The reopening of China and the expectation that Russia will reduce its oil production limited the fall of WTI.
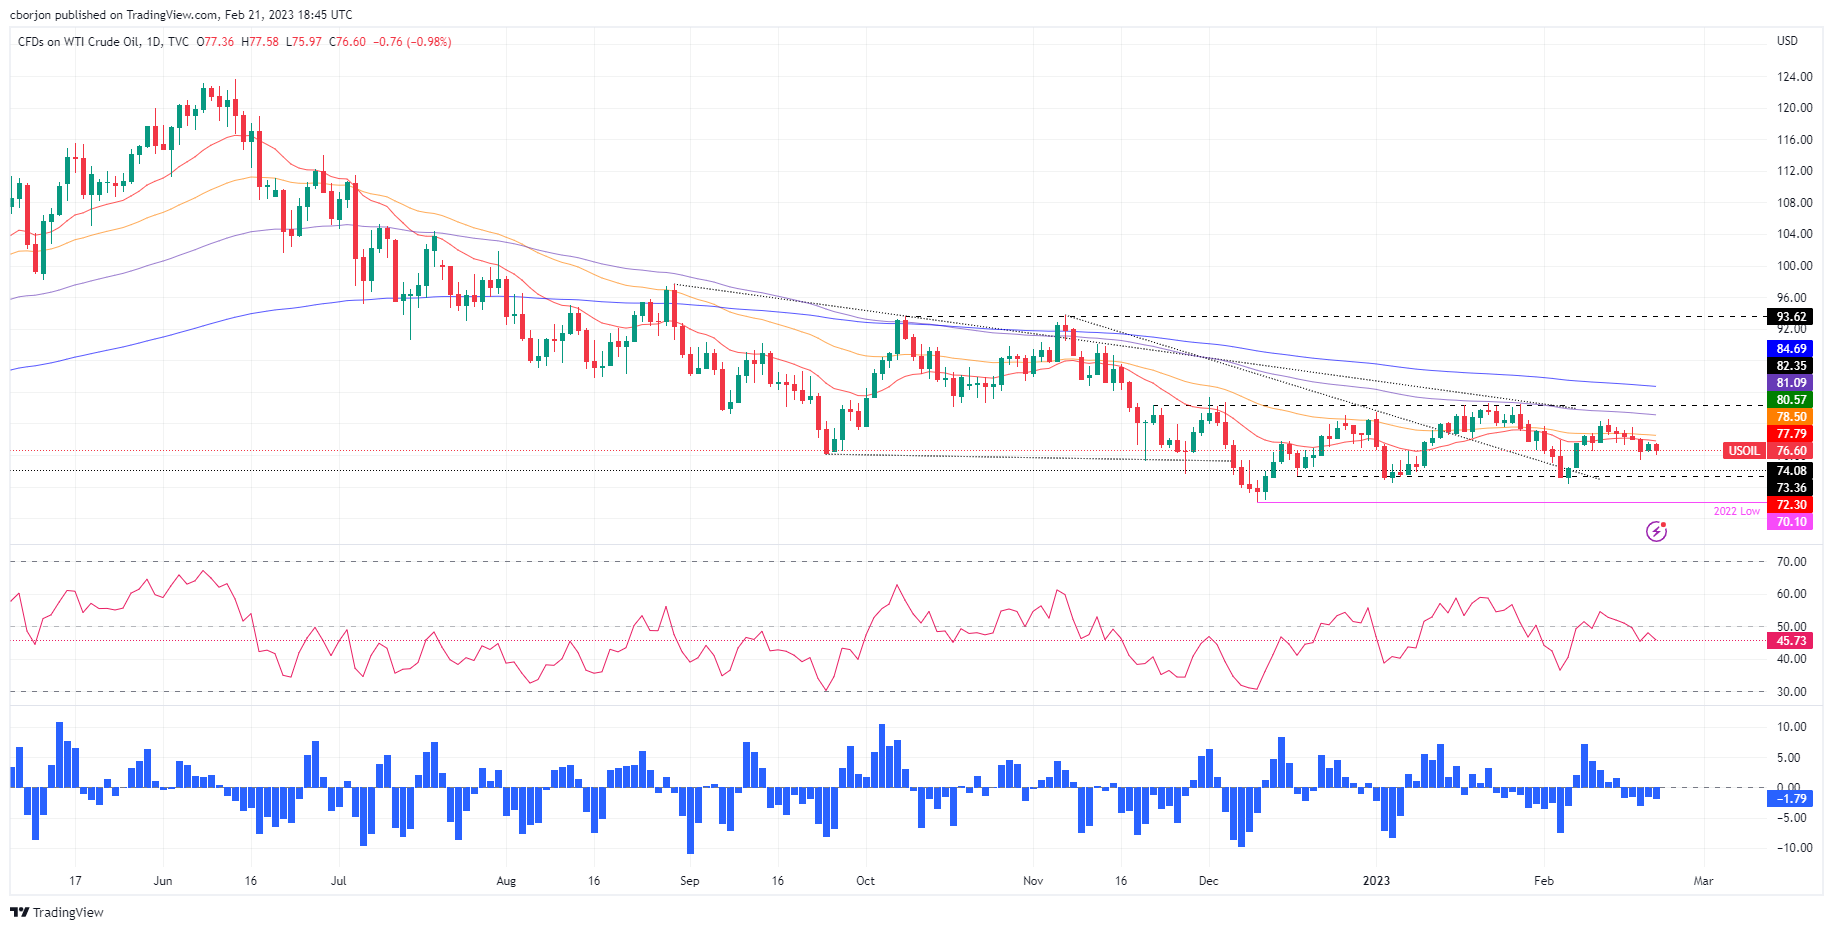
- WTI Technical Analysis: Neutral to Bearish Bias; once it breaks $75.00, it is likely to retest the monthly lows.
The Western Texas Intermediate (WTI), The US crude benchmark is erasing Monday’s gains, which fell short of the 20-day EMA, and fell towards weekly lows around $75.97 before settling around current price. . At the time of writing these lines, WTI lost 0.94% and is trading at $76.64 per barrel.
Oil Prices Affected by a Strong Dollar
The strength of the US dollar is affecting the commodity market. Over the past week, Federal Reserve (Fed) officials have continued their hawkish rhetoric, while data has supported some of their comments. Traders should remember that although Cleveland and St. Louis Fed Presidents Loretta Mester and James Bullard do not vote on the FOMC, they both supported raising rates by 50 basis points.
This gave rise to speculation that the US Federal Reserve (Fed) could raise rates not twice but three times, which could push the Federal Funds Rate (FFR) up to the 5.25%-5.50% mark.
Meanwhile, the US Dollar Index (DXY), which tracks the dollar’s value against a basket of six currencies, rose 0.29% to 104.184, putting a headwind for dollar-denominated assets. Therefore, a strong USD makes oil prices more expensive for foreign countries.
Apart from this, the reopening of China is a factor influencing the price of WTI, and it limited the fall in oil prices in the Tuesday session. Russia announced it plans to cut production by 500,000 bpd or around 5% of its output in March in retaliation for the West’s imposition of price caps on Russian oil and oil-related products.
As for the data, oil inventories and US data, which were due to be released on Tuesday, has been postponed in observance of President’s Day and moved to Wednesday and Thursday.
WTI Technical Analysis
From a technical point of view, WTI continues to have a neutral to bearish bias, limited by all the EMAs above the oil price. Furthermore, the Relative Strength Index (RSI) is in bearish territory and is pointing lower. The Rate of Change (Rate), though constant, shows that sellers continue to gain momentum.
Therefore, the first support for WTI would be $75.97. Once broken, the price of oil would fall to last week’s low of $75.36, followed by the MTD low of $72.30.
Source: Fx Street
I am Joshua Winder, a senior-level journalist and editor at World Stock Market. I specialize in covering news related to the stock market and economic trends. With more than 8 years of experience in this field, I have become an expert in financial reporting.


