
- An unconfirmed deal between the US and Iran could unlock Iranian oil exports and put pressure on WTI prices.
- Saudi Arabia’s crude oil production cut by 1 million barrels per day softens the fall in WTI.
- Dollar weakness caps WTI slide, while jobs report raises uncertainty about rate hike.
Western Texas Intermediate (WTI), the US benchmark crude, fell sharply during the North American session on Thursday, thanks to an “unconfirmed” report that the United States (US) and Iran may be close to reaching a temporary nuclear deal, which could unblock the sanctions imposed by the US on Iranian oil exports. WTI is trading at $70.38, losing 2.82% from its opening price.
Benchmark US crude plunges amid rumors of possible Iran sanctions easing
According to Reuters, “Oil fell after reports, citing sources, that Iran and the US are nearing a temporary deal that would see some sanctions relief in exchange for reducing Iran’s uranium enrichment.”
If Iran agrees to scale back its uranium-enriched development, it could export up to a million barrels a day of oil and access funds frozen abroad.
WTI’s decline was cushioned by Sunday’s meeting of the Organization of the Petroleum Exporting Countries and its allies (OPEC+), in which Saudi Arabia agreed to cut its crude production by 1 million barrels per day (bpd) in July, while the cartel tries to boost oil prices.
Another factor limiting WTI’s decline was US inventories, which fell last week by 451,000 barrels on June 2, the US Energy Information Administration (EIA) reported. Markets expected an increase of 1 million barrels per day.
In particular, the dollar posted several losses after a labor market report indicated that jobless claims in the United States (US) beat estimates. Following these data, the consensus among investors that the US Federal Reserve (Fed) will not raise rates at the June meeting weakened the dollar. The Dollar Index (DXY) fell 0.67% to 103.347.
WTI Price Analysis: Technical Perspective
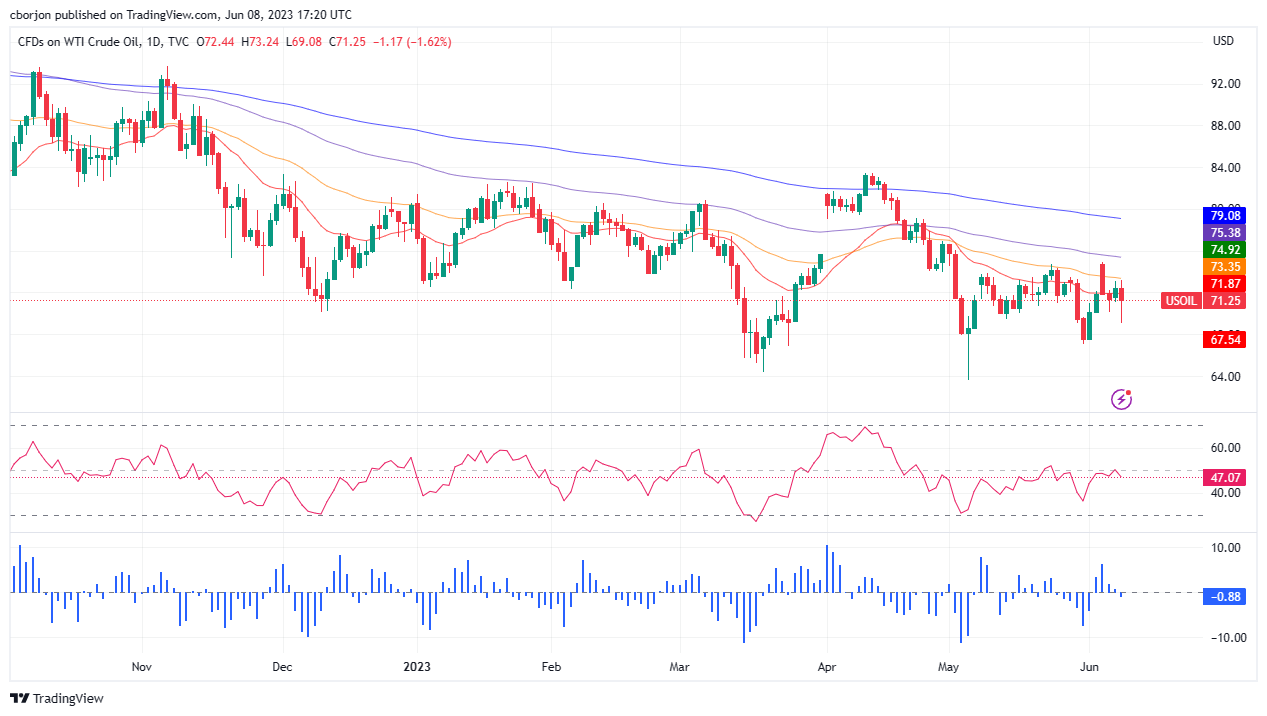
WTI maintains a neutral bias to the downside, although it remains below the 20-day EMA with first resistance at $71.86. Oil will continue its downtrend beyond that zone and may challenge the 2023 low at $63.61 if sellers reclaim the May 31 low at $67.08. It has to be said that the oscillators justify further declines, but if WTI breaks above the 20-day EMA and breaks above the 50-day EMA at $73.35, that could pave the way for further gains.
Source: Fx Street
I am Joshua Winder, a senior-level journalist and editor at World Stock Market. I specialize in covering news related to the stock market and economic trends. With more than 8 years of experience in this field, I have become an expert in financial reporting.


