
- WTI falls to $66.80, influenced by the slowdown in the global economy and lower oil price forecasts.
- Goldman Sachs revises the WTI forecast for the end of the year to $81 per barrel given the possible increase in supply.
- Upcoming US CPI data and Fed decisions are closely watched; the Saudi production cut provides a slight cushion.
Western Texas Intermediate (WTI), the benchmark US crude, plunges sharply on slowdown in the global economy and analysts’ lower oil price forecasts ahead of the release of inflation data in United States (USA) and the Federal Reserve (Fed) meeting on Wednesday. WTI is trading at $66.80, plunging almost 5% after hitting a daily high of $70.22.
Forecast US Inflation Data and Fed Meeting Influence Oil Market as Goldman Sachs Cuts WTI Estimate for Year-End
Wall Street is trading with solid gains at the start of the week. Expectations of increased supplies from Russia and Iran prompted a revision of Goldman Sachs’ forecasts, which revised WTI down from $89 a barrel to $81 by the end of the year.
Weaker-than-expected data last week from China, which showed exports contracted above estimates, painted a grim picture for global demand among developed markets. Coupled with speculation that the People’s Bank of China (PBOC) will cut rates to stimulate the economy, it led to Monday’s slide despite OPEC+ efforts to dampen oil prices.
Meanwhile, in the US, the consumer price index (CPI) for May will be released, which is expected to show the impact of a 500 basis point (bp) rate hike by the Fed. Upside surprises in the data is likely to trigger a Fed reaction, as Jerome Powell and company will reveal their decision around 18:00 GMT on Wednesday.
Further Fed hikes would boost the US dollar (USD), a headwind for dollar-denominated assets. However, the decline in WTI was capped by the Saudis, who vowed to cut oil production in July.
WTI Price Analysis: Technical Insights
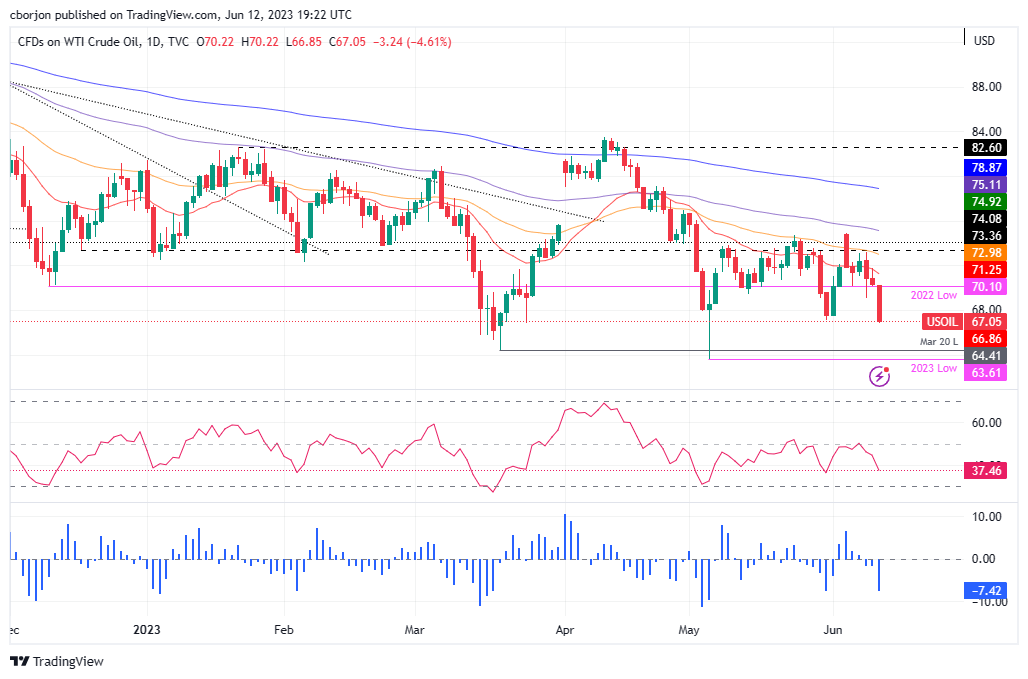
The US crude oil benchmark fell below the May low of $67.08, opening the door for further losses, below the $67.00 signal, bringing into play the March 20 swing low at $64.41, before challenging the year-to-date low of $63.61. To the upside, the first resistance for WTI would be the 2022 low at $70.10, followed by the 20-day EMA at $71.23. If the latter is broken, the 50 day EMA would sit at 72.97.
The Relative Strength Index (RSI) and Three-Day Exchange Rate (RoC) show sellers gaining momentum, so further declines are expected.
Source: Fx Street
I am Joshua Winder, a senior-level journalist and editor at World Stock Market. I specialize in covering news related to the stock market and economic trends. With more than 8 years of experience in this field, I have become an expert in financial reporting.


