
- The Central Bank of China cuts rates on key loans in response to slowing economic recovery, weighing on the outlook for global oil demand.
- OPEC+ supply cuts from Saudi Arabia and Russia offer limited support, while WTI pulls back from year-to-date highs.
- Barclay revises Chinese GDP forecasts down, while WTI finds some relief in rising output from Chinese refineries.
US benchmark Western Texas Intermediate (WTI) posts losses of more than 2% as economic data from China reflects a slowing recovery, while the People’s Bank of China (PBoC) unexpectedly cuts rates the key rates to reactivate the economy after the Covid-19 pandemic. WTI is trading at $80.49 per barrel, losing 2.35%.
Disappointing Chinese retail sales and industrial production data weigh on crude oil; PBoC rate adjustments raise concern
The latest round of economic data from China, with retail sales below estimates and industrial production disappointing market participants, prompted a reaction from the PBOC. The Chinese central bank cut its 7-day loan rates by ten basis points to 2.80%, and applied the same measures to the overnight standing facility (SLF) rate, which went from 2.75% to 2.65%.
This, together with the supply cuts applied by Saudi Arabia and Russia, which are part of the Organization of the Petroleum Exporting Countries and its allies (OPEC+), has contributed to giving an oxygen balloon to the recovery of Oil, with the reversal of prices from the maximums recorded so far this year.
Concerns in the investment community about China reaching its 5% growth target for the year would likely put pressure on WTI prices. On Tuesday, Barclay’s cut the Chinese GDP forecast to 4.5%, citing continued deterioration in the housing market.
By contrast, the fall in WTI was cushioned by the level of technical support and by the forecast of Chinese refiners, which rose 17.4% in July compared to the previous year. WTI traders’ attention is now focused on US crude oil inventories.
WTI Price Analysis: Technical Perspective
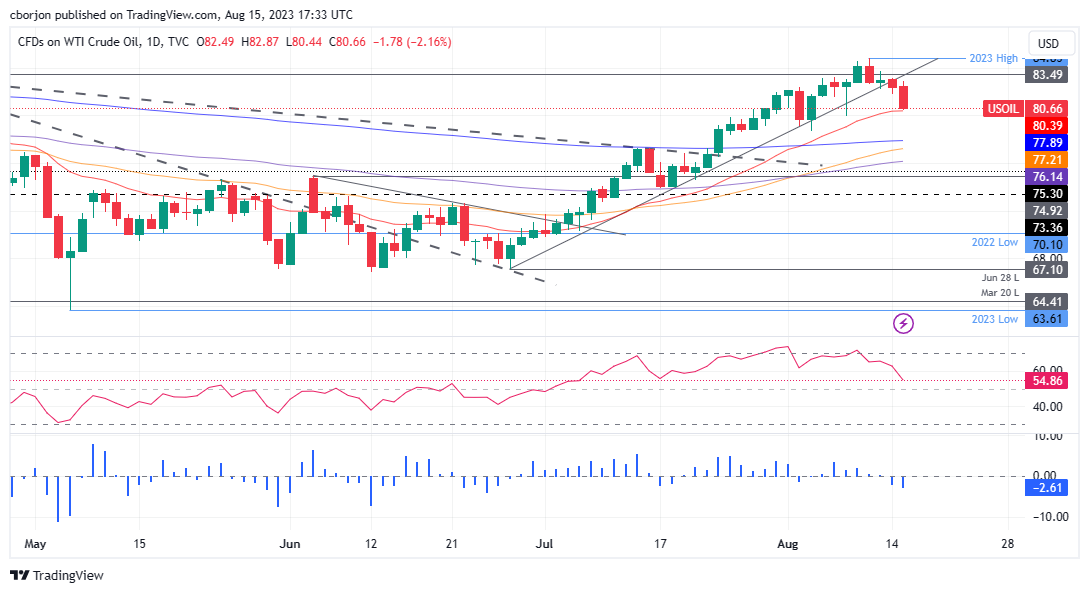
WTI reversed its trend and fell towards the 20-day EMA at $80.47 per barrel, considered as the first support, which, if broken, may pave the way for WTI to break below $80.00 . A break of the latter would expose the August 3 daily low at $78.74, followed by the 200 day EMA at $77.89. Conversely, if WTI sustains above $80.00, it would be positive for buyers, who could retest the year-to-date high of $84.85, but first have to break above the daily high of May 23. April $83.49.
Source: Fx Street
I am Joshua Winder, a senior-level journalist and editor at World Stock Market. I specialize in covering news related to the stock market and economic trends. With more than 8 years of experience in this field, I have become an expert in financial reporting.


