
- WTI hit $85.50 as markets react to Israel’s expanded land operations in the ongoing Gaza conflict.
- Reported progress in ceasefire talks appears to have little effect.
- Crude oil will remain exposed to upside risks due to the weight of geopolitical tensions.
He West Texas Intermediary (WTI) rose to three-day highs above $85.00 per barrel following reports of a rapid escalation of Israeli ground attacks in Gaza, along with the complete disruption of telephone and internet communications in the Gaza Strip.
According to Paltel Group, a Palestinian telecommunications company and one of the largest employers in the entire West Bank after the Palestinian government, Israel’s latest offensive air-to-ground bombings have completely decimated the telecommunications infrastructure in Gaza.
The Israeli escalation of combined ground and air troop attacks on “underground targets” comes a day after Iranian Foreign Minister Hossein Amirabdollahian threatened that the United States would “not be spared from this fire” if Israel continues its escalation against Hamas. Iranian Foreign Minister Hossein Amirabdollahian made these statements on Thursday at the United Nations (UN) headquarters.
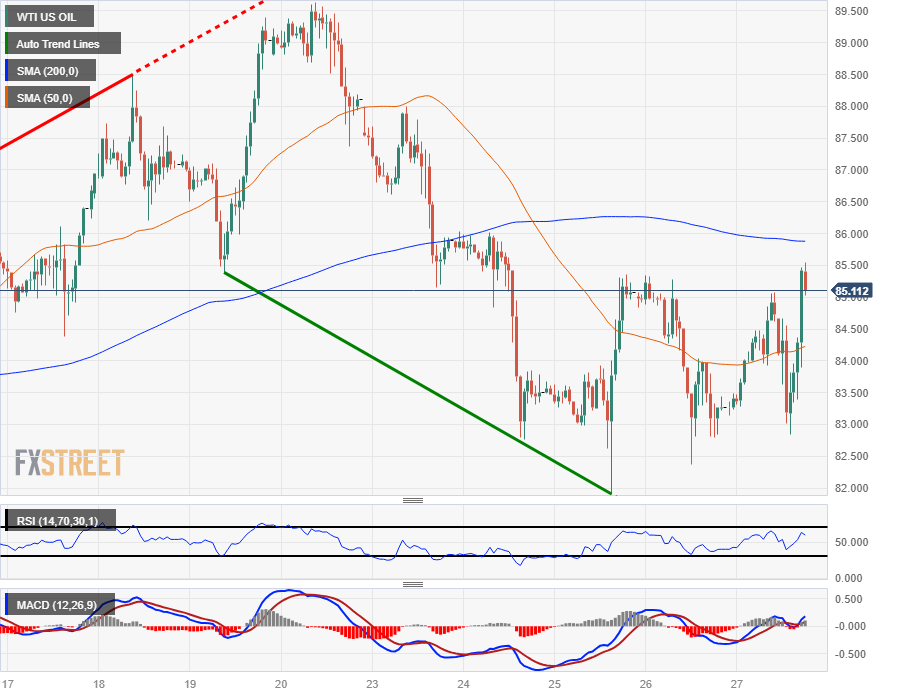
WTI Technical Outlook
After hitting three-day highs, WTI crude oil is retreating towards $85.00 per barrel as short-term investors take early profits following the latest spike in volatility.
Crude oil is trading on the north side of the week’s consolidation between $85.00 and $82.00.
$82.00 is proving to be a significant technical support level, while a bearish break will see barrel bids challenging the 200-day simple moving average (SMA) currently parked near $78.00.
At the top, the latest high lies just below the psychological level of $90.00, while a break above the 2023 ceiling of $93.98 would see WTI setting a 14-month high in the $94.00 area.
WTI Daily Chart
WTI technical levels
Source: Fx Street
I am Joshua Winder, a senior-level journalist and editor at World Stock Market. I specialize in covering news related to the stock market and economic trends. With more than 8 years of experience in this field, I have become an expert in financial reporting.


