
- Oil prices fall from the $90.00 zone to levels close to $88.00.
- The strength of the dollar, after the Fed’s decision, is weighing on crude oil prices.
- WTI is facing a key resistance zone at $90.00.
WTI Oil It may have peaked above $90 this week as crude prices pulled back on Thursday, paring gains after a two-day rally. The West Texas Intermediate has depreciated about 2% so far this day, weighed down by the strength of the US dollar.
The US dollar soars after the Fed decision
The rise in the dollar has pushed down crude oil prices following the US Federal Reserve’s monetary policy decision on Wednesday. The entity raised rates by 0.75%, as expected, and confirmed its commitment to continue to tighten borrowing costs.
Fed Chairman Jerome Powell surprised the market with aggressive rhetoric at the press conference, rejecting the idea that the bank may have tightened too much and suggesting that interest rates could reach levels higher than expectations. From the market. These comments dampened investors’ expectations of a dovish pivot in December and sent the US dollar soaring across the board.
However, US macroeconomic data was not particularly supportive of the dollar on Thursday, especially the ISM services PMI, which showed a weaker-than-expected rise in sector activity in October, causing a pullback. dollar moderate.
WTI capped below trendline resistance near $90.00
From a broader perspective, WTI remains in its uptrend from late September lows, albeit capped by trend line resistance from early July highs, now at $90.00, which should give way to expose the 100-day SMA at $91.50 before the Oct 10 high at 92.55.
To the downside, below session lows at $87.00, a successful move beyond the 50-day SMA and trend line support near $85.50 would negate the short-term uptrend by exposing the low of the October 31 at $84.70.
WTI0 daily chart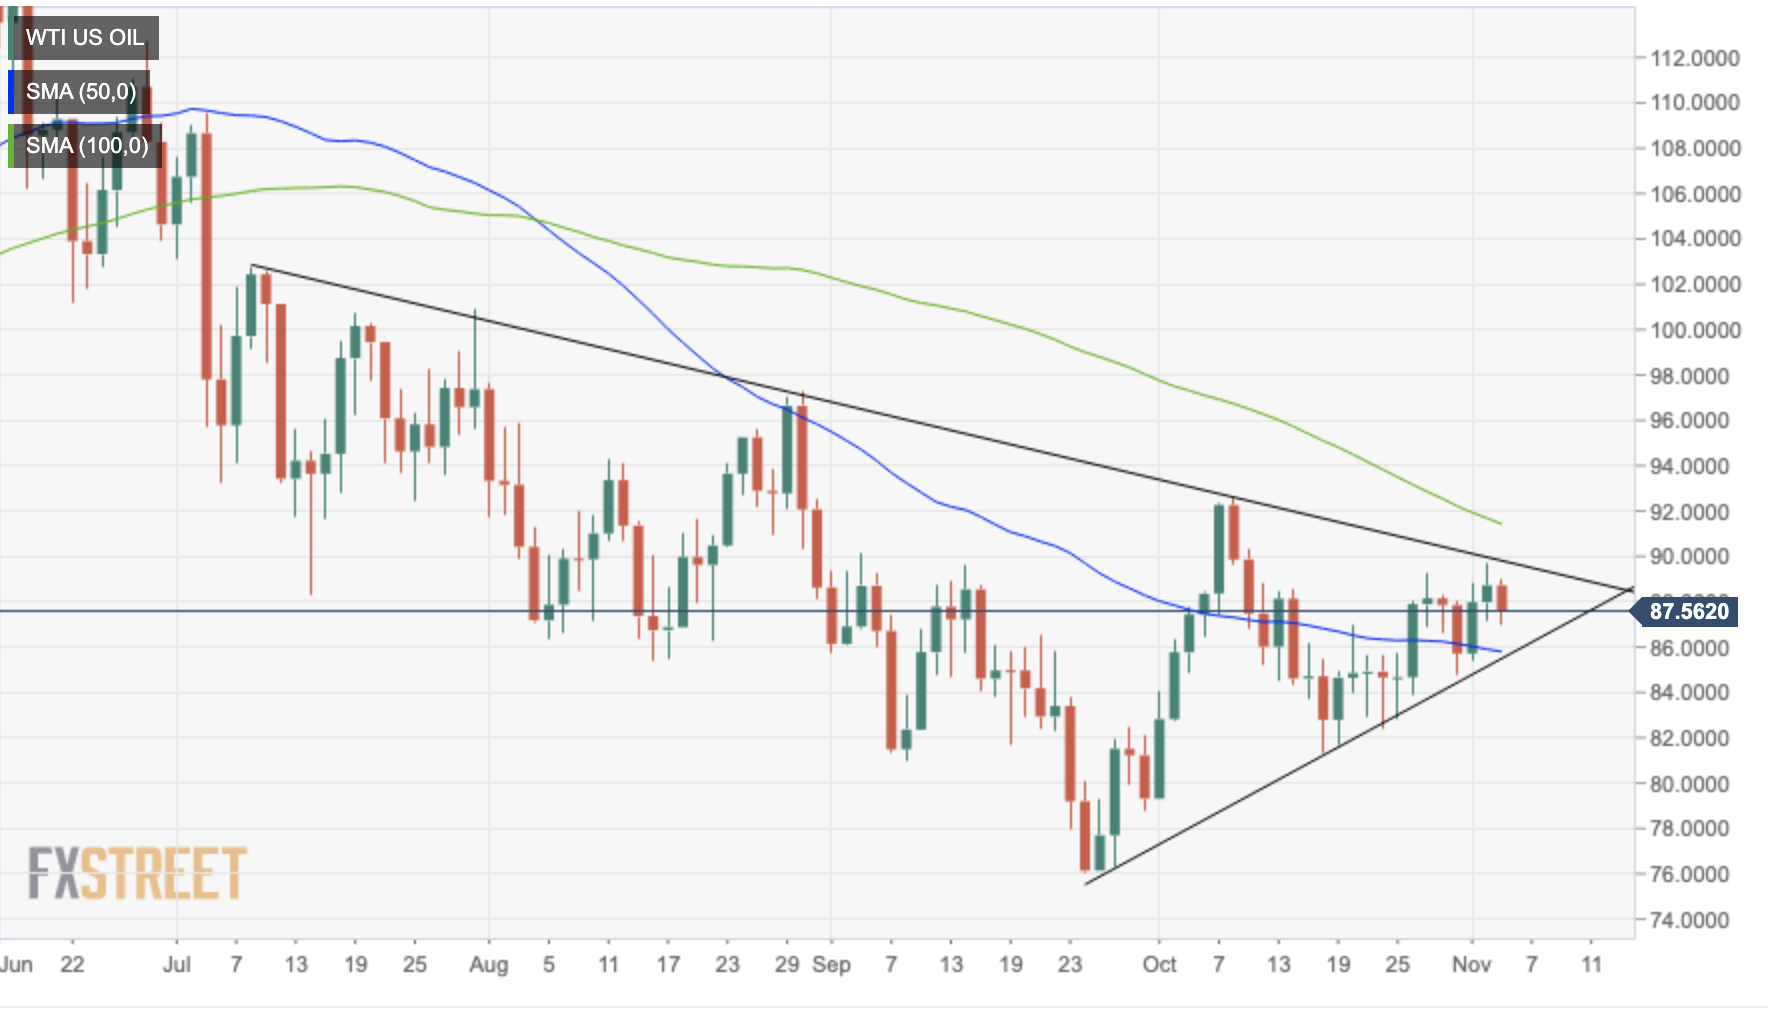
Technical levels to watch
Source: Fx Street
With 6 years of experience, I bring to the table captivating and informative writing in the world news category. My expertise covers a range of industries, including tourism, technology, forex and stocks. From brief social media posts to in-depth articles, I am dedicated to creating compelling content for various platforms.


