
- Oil is rising to a cluster of important daily moving averages at $79.00.
- These will likely present a difficult level of resistance for the raw material.
- The persistence of the short-term uptrend will depend on a decisive break of this resistance barrier.
WTI oil is trading at $78.50 during the US session on Friday.
On the 4-hour chart used to assess the short-term trend, oil has decisively broken out of a descending channel and reached the conservative breakout target at $78.17 (0.618 Fib extension of channel width extrapolated upwards).
Oil 4-hour chart

Since breaking through the channel, oil is now likely in a short-term uptrend with odds favoring further near-term upside as “the trend is your friend.” However, it has now reached its initial target, making it vulnerable to a pullback.
A break above the last lower high of the previous downtrend at $80.36 (May 29 high) would provide additional bullish confirmation and extend the uptrend. Such a move could be expected to reach the next key target at $83.50 (April 29 high and top of the chart gap).
Oil’s direction is less clear on the daily chart used to assess the medium-term trend.
Daily Oil Chart
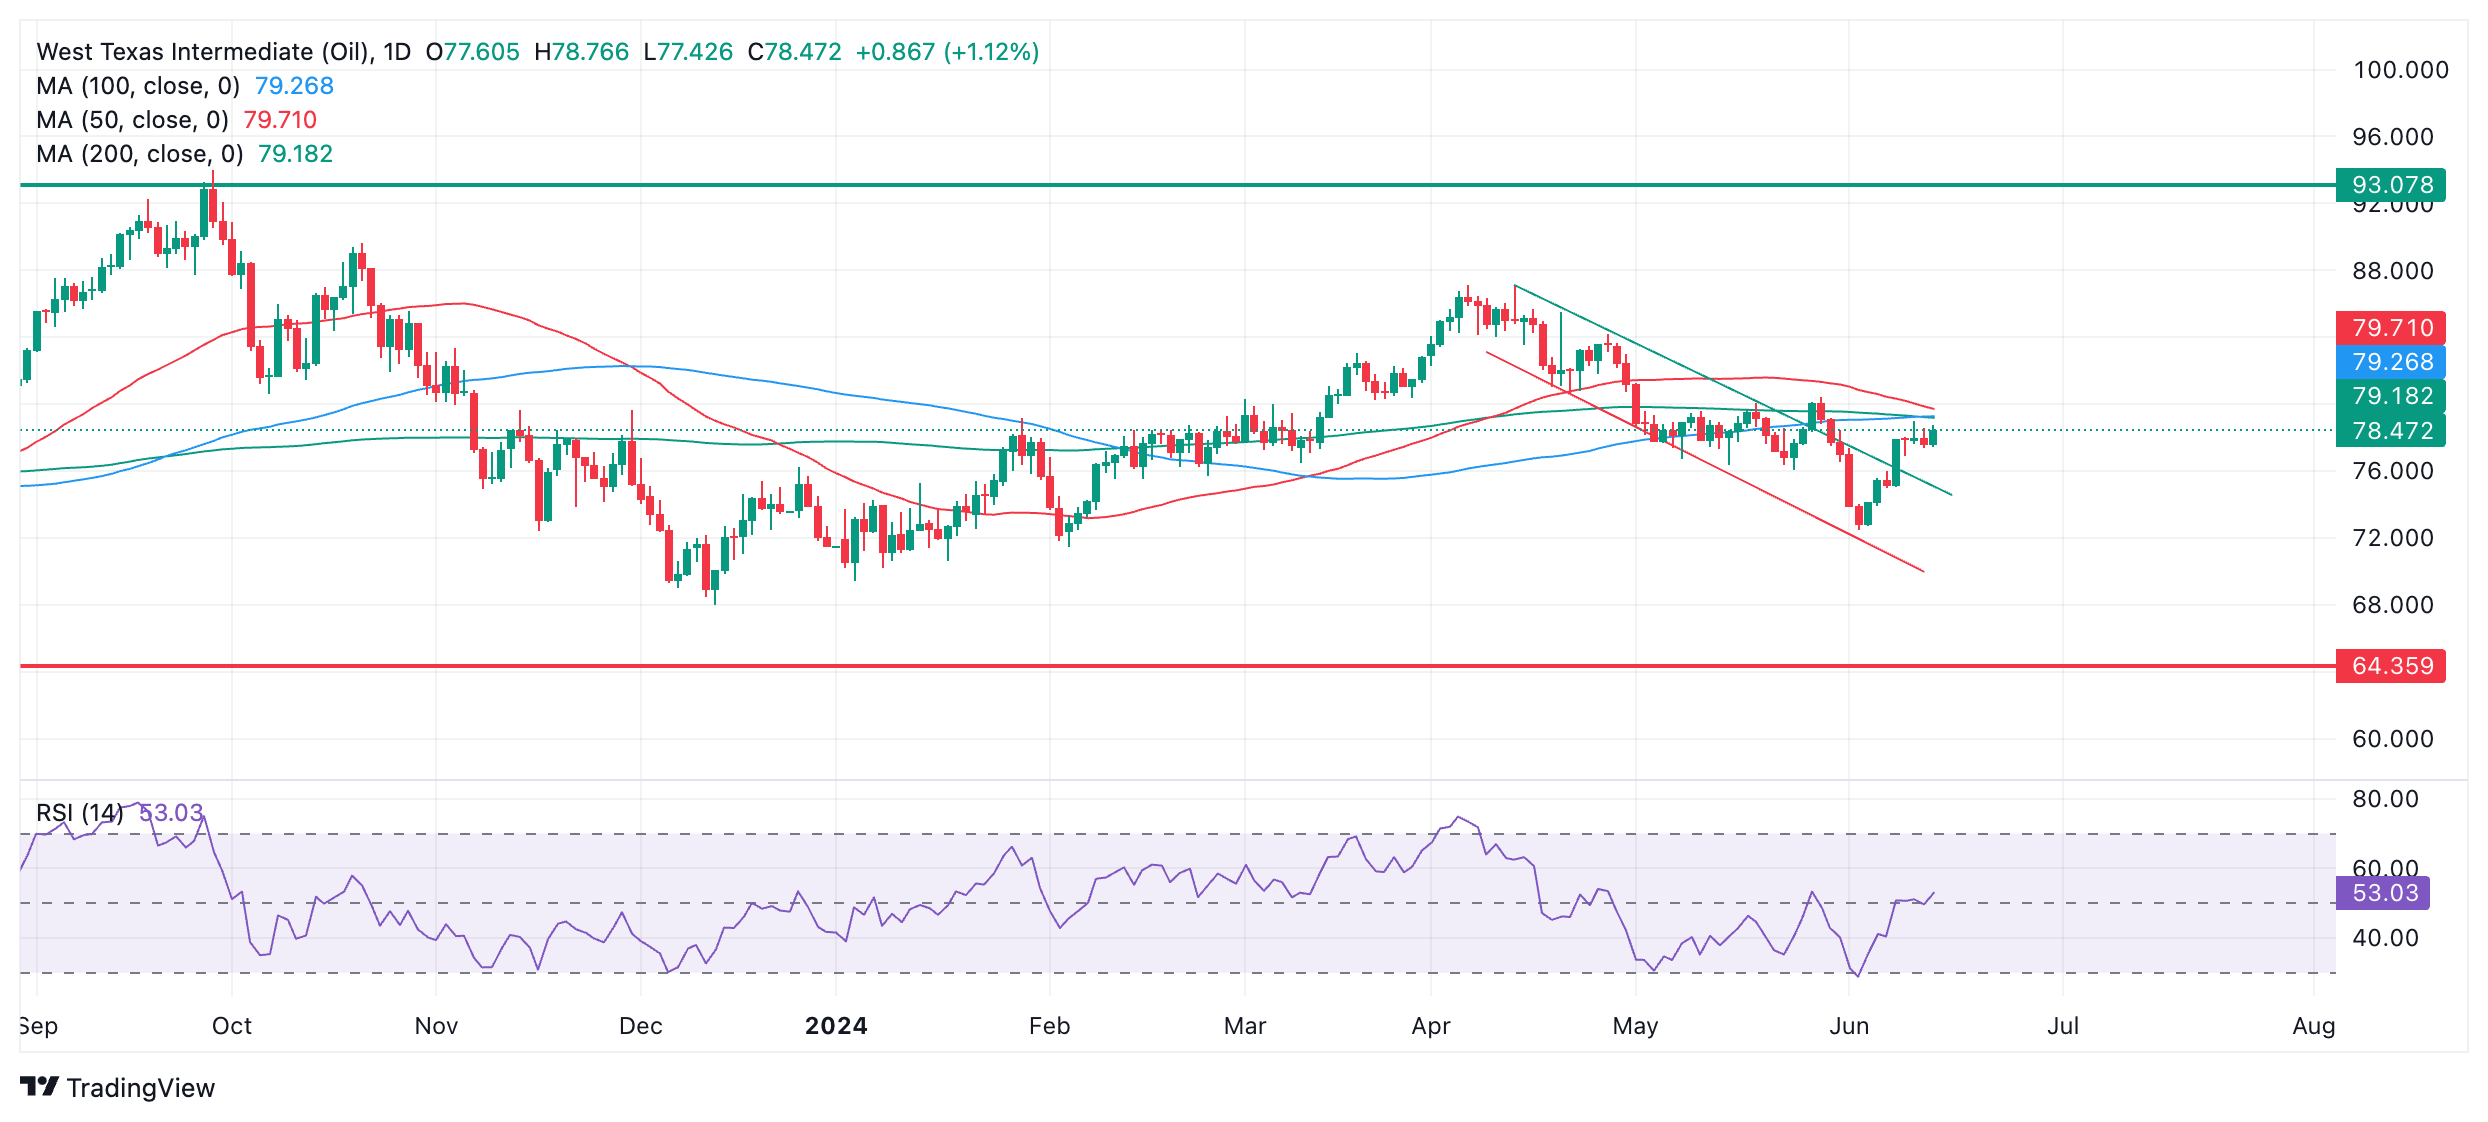
The key feature on the daily chart is the resistance cluster at $79 on all major simple moving averages (SMAs): the 50-day, 100-day, and 200-day SMA. This will likely present a considerable barrier to further increases and could be a turning point for the oil price.
A daily close above $80.36 (May 29 high) would be required to confirm a successful break above the three SMA resistance and a continuation to a target at $83.50.
WTI oil appears to be trading within a wide long-term range between $64.00 and $93.00 on the weekly chart. This suggests that the long-term trend is likely sideways.
Weekly Oil Chart
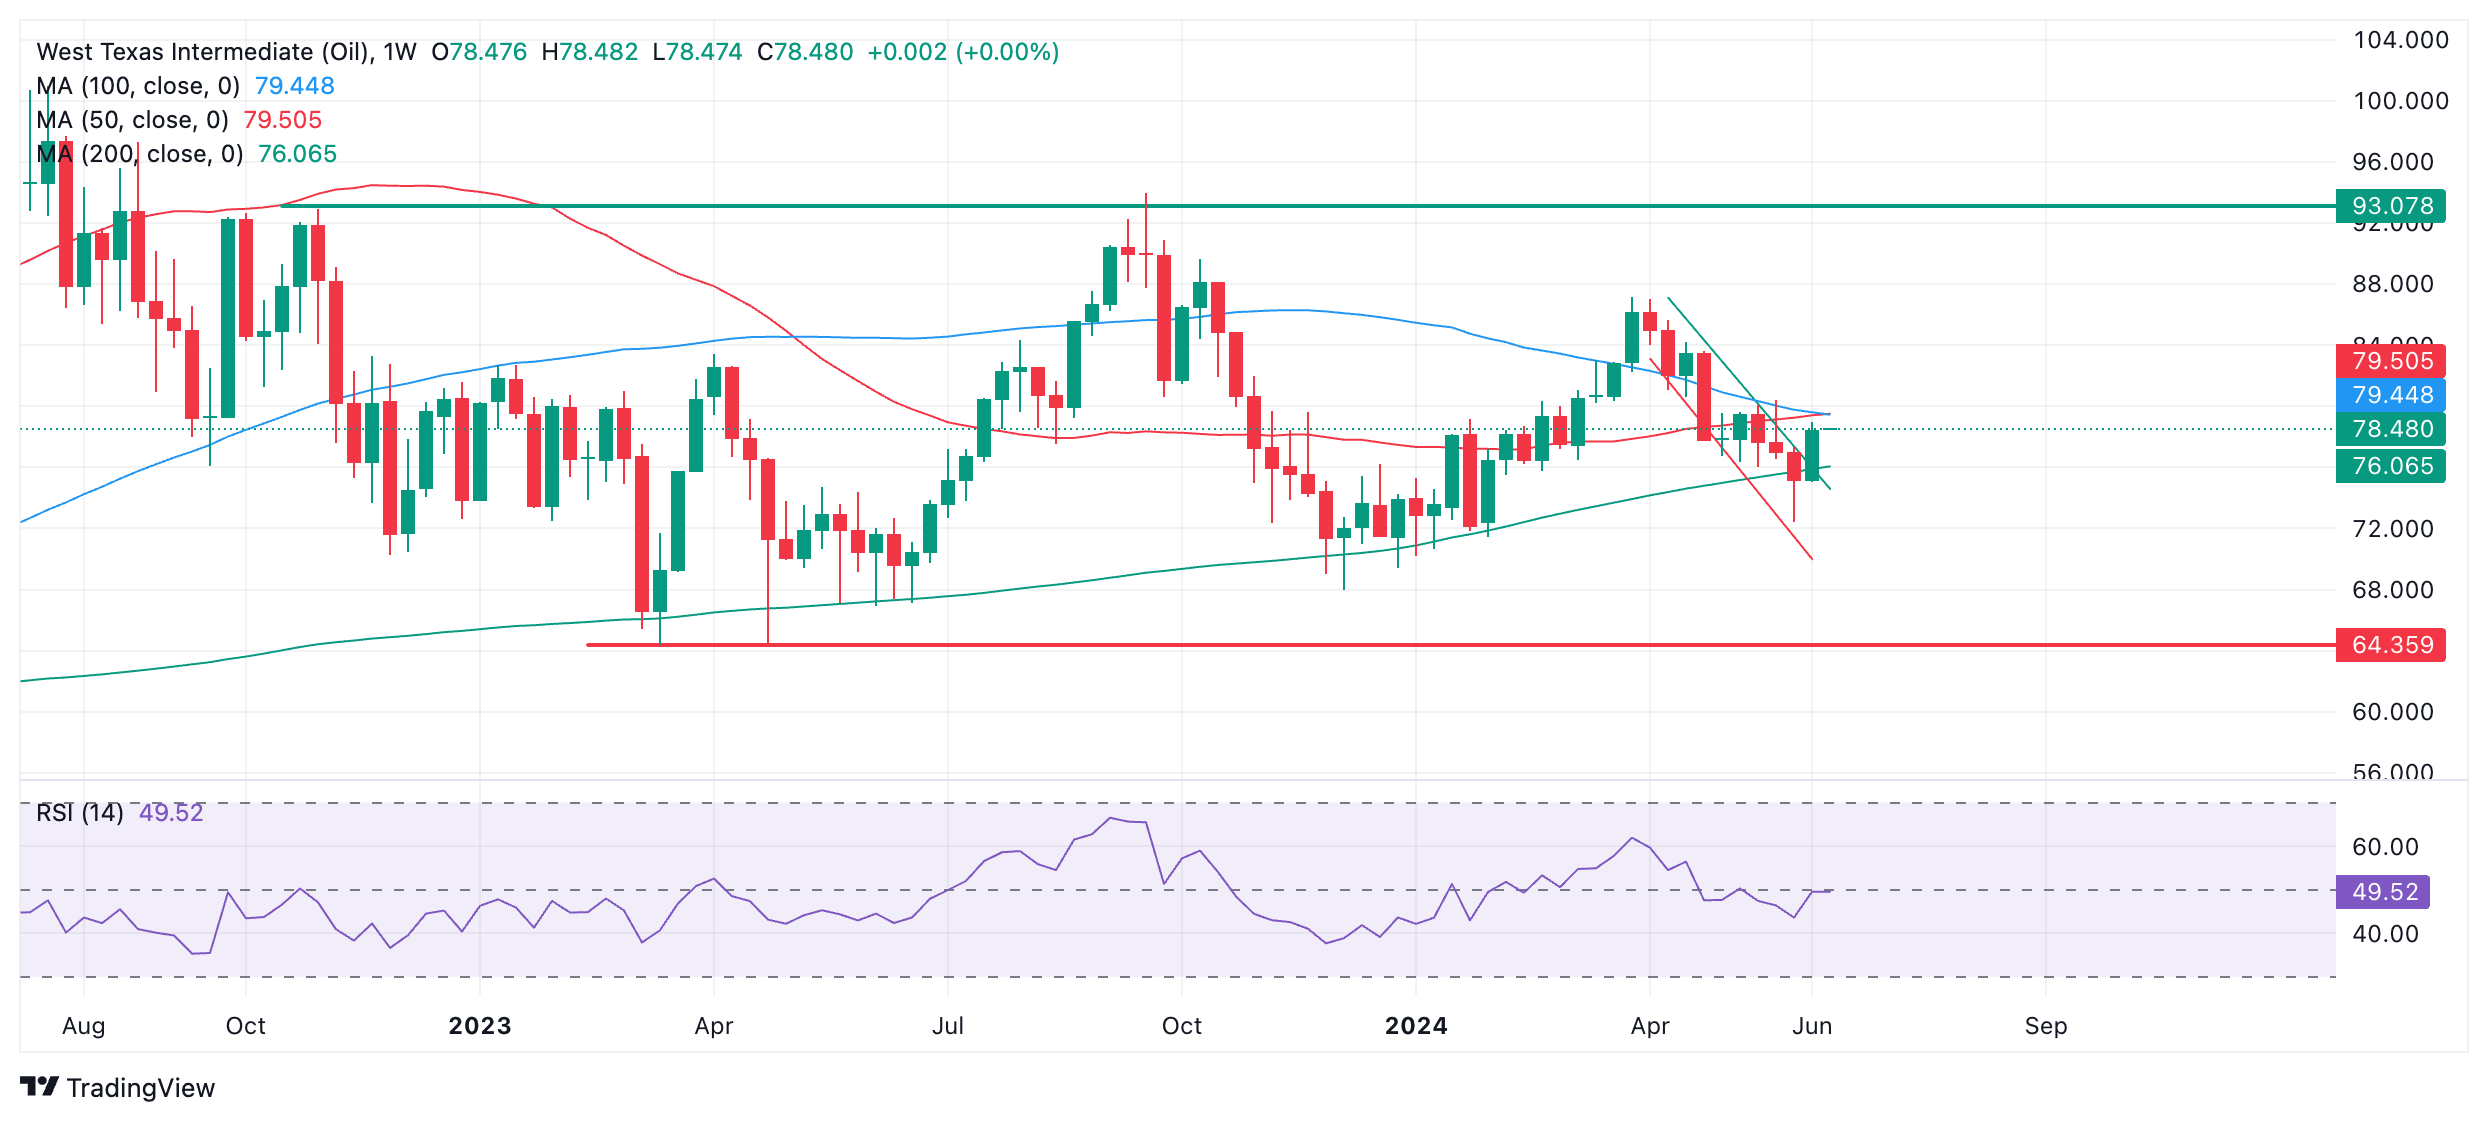
Last week’s candlestick could be a sign that the downward move is over and the oil price may be reversing. Candlesticks of similar shape often mark the end of downward movements in asset prices. The price of oil may be about to begin a bullish sequence.
The 200-week SMA has acted as reliable support on multiple occasions in 2023-24 and is providing support again at the current week’s lows. The reliability of the 200-week SMA further strengthens the case for a bullish reversal.
Source: Fx Street
I am Joshua Winder, a senior-level journalist and editor at World Stock Market. I specialize in covering news related to the stock market and economic trends. With more than 8 years of experience in this field, I have become an expert in financial reporting.


