
- The M formation in the WTI is in play in a swinging trade on Monday.
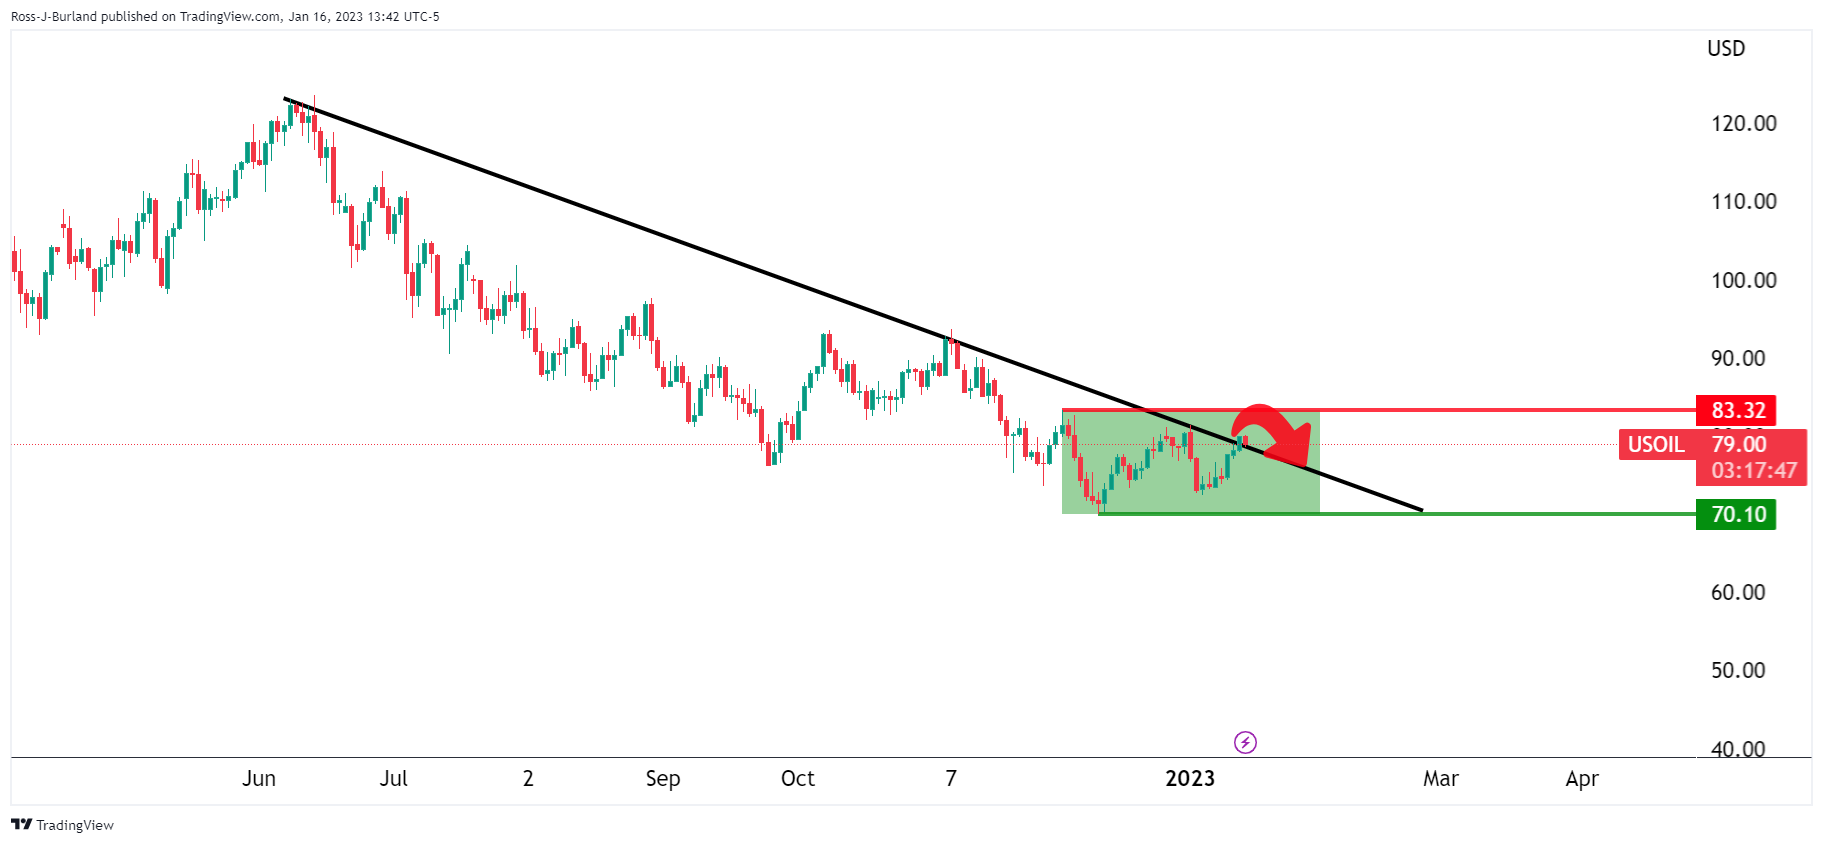
- The daily chart parameters keep the price trapped in a range, testing the resistance of the daily trend line.
Oil has fallen in thin trading at the start of the week with US stocks closed for the Martin Luther King, Jr, holiday. The West Texas Intermediate is trading around $79.00 and has fallen 1.25%.
Technically, the formation of the M on the 4-hour chart is a reversal pattern that would be expected to send price to the Fibonacci scale drawn in the range of the previous bearish momentum. The 38.2% Fibonacci level aligns with a structure near $79.15 that could act as resistance on a restest.
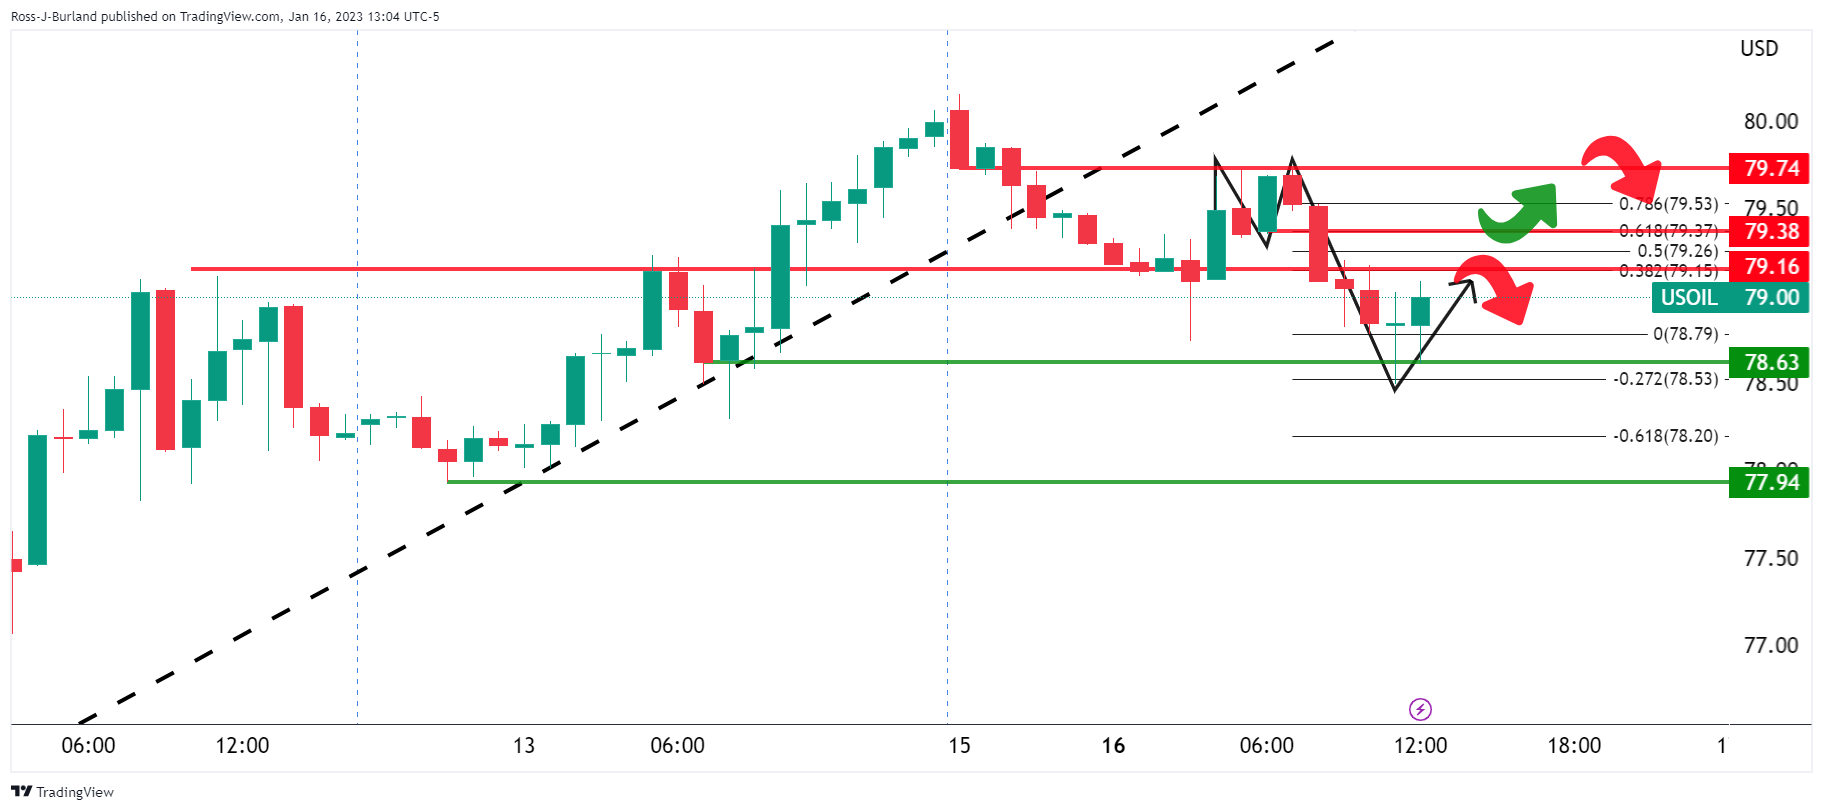
If price were to break there, then a 50% mean reversion would be a likely scenario before the 61.8% Fibonacci level meets the neckline of the M pattern near $79.38. Above there, the double top of the M formation sits at around $79.75. The stops above will be around $80.00. However, as the market is in an uptrend, the downside will remain favorable until the bulls can break above the $83.32 daily high and structure:
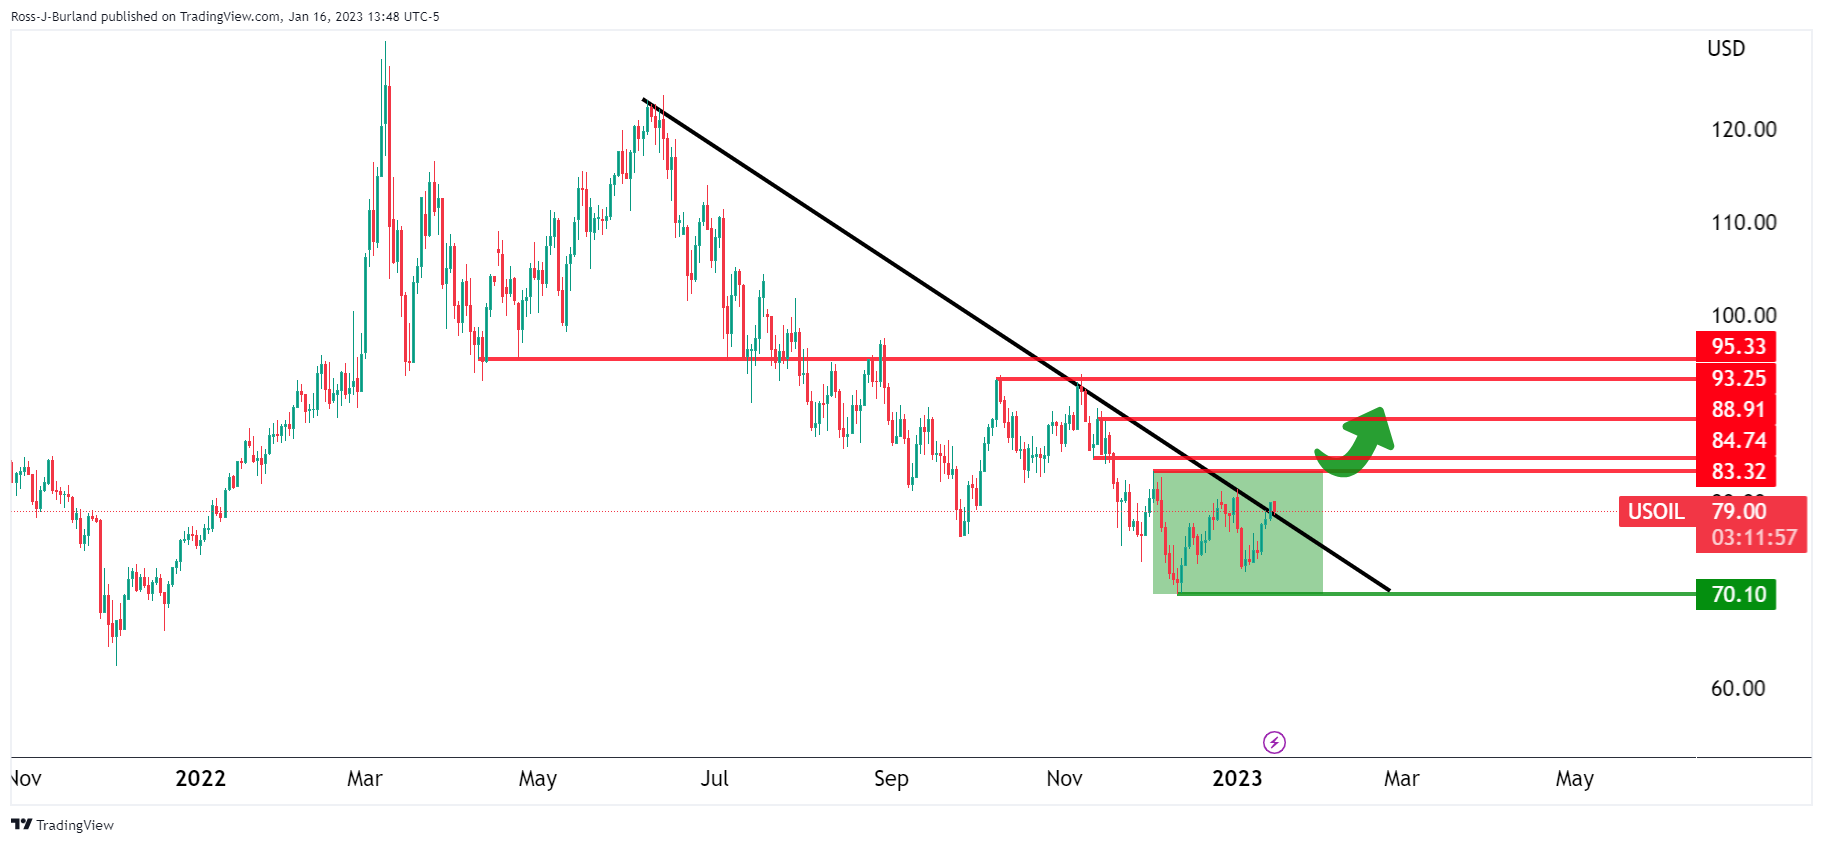
Elsewhere, a break in the structure opens the risk of a run to 93.25/95.33 and higher in a correction to the early summer 2022 bear cycle:
Source: Fx Street
I am Joshua Winder, a senior-level journalist and editor at World Stock Market. I specialize in covering news related to the stock market and economic trends. With more than 8 years of experience in this field, I have become an expert in financial reporting.


