
- WTI was helped by the weaker dollar, although it struggled to break above key resistance.
- The slowdown in the US Consumer Price Index (CPI) and expectations of a Fed turnaround may support WTI prices.
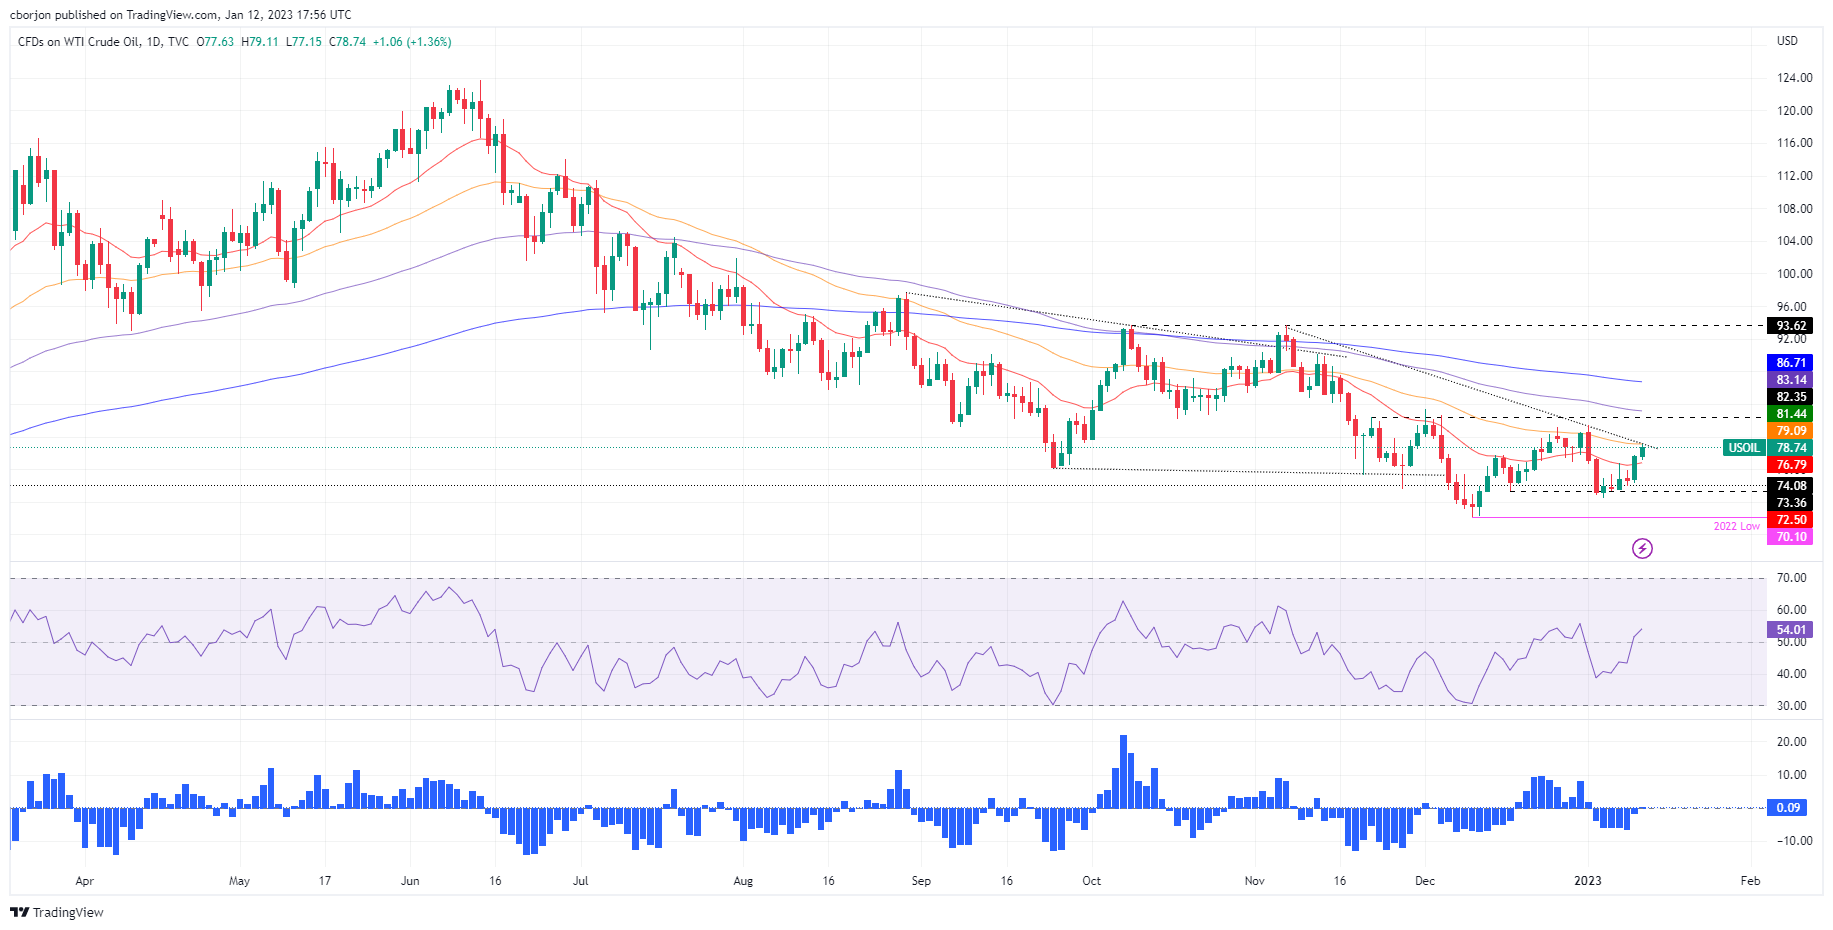
- WTI Price Analysis: It is facing a wall of resistance around $79.00.
The Western Texas Intermediate (WTI)the benchmark US oil, advances on Thursday and extends its gains to two consecutive daysalthough limited by technical indicators following the release of crucial US inflation data. As of this writing, WTI is trading around $78.99 a barrel, gaining 1.52% on the day .
The US Consumer Price Index (CPI) for December fell 0.1%According to the Department of Labor, suggesting that the US Federal Reserve (Fed) could slow the pace of rate hikes, a headwind for the dollar. Therefore, oil prices rose as a weaker dollar would benefit crude buyers.
Another factor that propped up WTI is the reopening of China after authorities removed zero-covid policies.
Sources quoted by Reuters commented that a soft landing in the US and perhaps worldwide, combined with China’s economic rebound, could lead to a much better year than most analysts feared. So, oil demand could increase, and WTI prices would remain high unless production increases.
Oil traders are also bracing for a new curb on Russian oil supplies, pending the start of sanctions over its invasion of Ukraine. EU ban on importing oil products from Russia will start on February 5 and, according to the US office of the EIA, “could be more disruptive than the EU’s ban on importing crude oil from Russia.”
WTI Price Analysis: Technical Perspective
From the point of view of the daily chart, the WTI presents a neutral to bearish bias, although it has extended its gains to almost $4 in the last two days. The inability of WTI to break the confluence of a two-month downtrend line and the 50 day EMA around $79.00 could exacerbate a pullback, at least down to the 20-day EMA at $76.79. However, if WTI breaks above the former, a rally towards the lowers could ensue. $80.00. On the other hand, if it breaks below the $78.00could pave the way to the $76.00.
Source: Fx Street
I am Joshua Winder, a senior-level journalist and editor at World Stock Market. I specialize in covering news related to the stock market and economic trends. With more than 8 years of experience in this field, I have become an expert in financial reporting.


