
- WTI tests the $93/bbl level in Wednesday trading.
- US crude oil rises sharply after a surprising drawdown in reserves.
- Supply constraints are stifling oil prices, driving up barrel prices.
US crude oil prices WTI (West Texas Intermediary) They soar today, driven by an unexpected reduction in crude oil reserves in the United States. WTI hit a 13-month high of $93.18 and is poised to continue rising as prices hover around $93.00.
Crude Oil inventories from the Energy Information Administration (EIA) showed a surprise drop in US crude oil reserves, with domestic supply declining more than 2 million barrels versus the -320,000 forecast.
Reserves at the Cushing, Oklahoma, oil reservoir showed declines of just under a million barrels, adding to last week’s decline of more than 2 million barrels.
The EIA estimates that US crude oil reserves now stand at just below 420 million barrels.
As demand for oil continues to rise, global energy production is expected to remain below supply equilibrium for the foreseeable future until production increases. It is estimated that the current daily crude oil supply deficit is around 2 million barrels.
Saudi Arabia and Russia recently announced an extension of their combined production cuts of 1.3 million bpd until the end of the year, and Russia is adding to price pressures by further restricting oil exports out of Russia.
WTI Technical Outlook
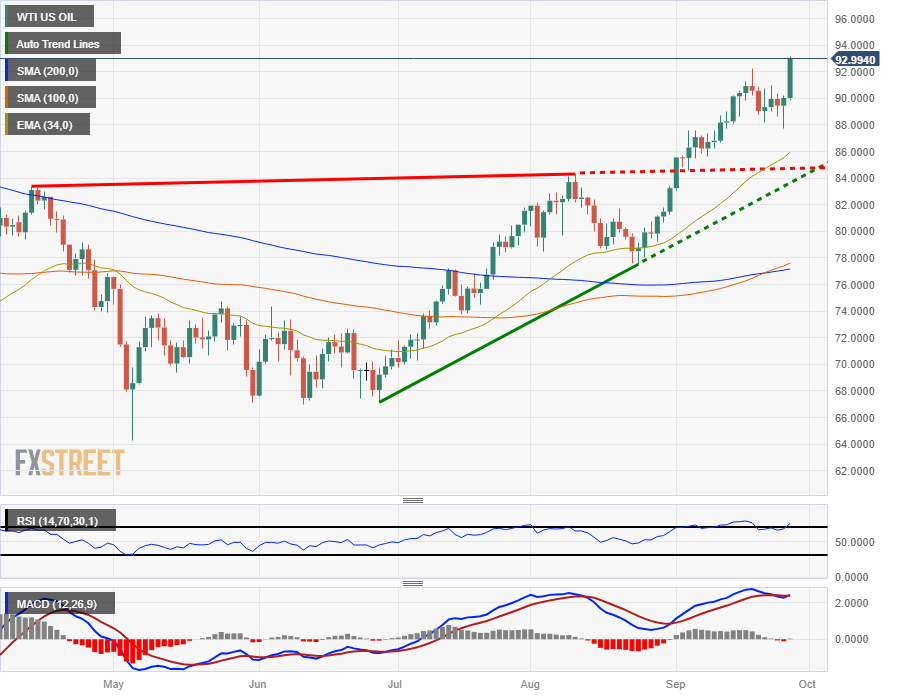
With WTI setting new 13-month all-time highs, technical resistance is fading on both the intraday and long-term outlook. Oil bidders will immediately look for a push towards $94/bbl, but with US crude prices so high for so long, a prolonged rally could cause technical indicators to reset ahead of a new push higher.
WTI is up almost 20% from the last swing low near $78.00, and an ascending trend line from the June low near $68.00 is providing additional technical support.
A break of the 34-day EMA, currently at $86.00, could lead to a bounce, while a successful bearish break would have to contend with the 200-day SMA near $77.00. $.
WTI daily chart
WTI technical levels
Source: Fx Street
I am Joshua Winder, a senior-level journalist and editor at World Stock Market. I specialize in covering news related to the stock market and economic trends. With more than 8 years of experience in this field, I have become an expert in financial reporting.


 meeting for peace: “First step towards reconciliation”")


