
- The price of WTI crude oil, the benchmark in the United States, rises more than 2% amid the escalation of geopolitical tensions in the Middle East.
- Contributing to the recovery are attacks on ships around the Red Sea by a militant group linked to Iran, affecting maritime oil routes.
- The recent weakening of the US Dollar following the Federal Reserve’s turnaround, along with geopolitical risks, will support the price of WTI.
The price of benchmark US crude oil, also known as West Texas Intermediate (WTI), has risen more than 2% on geopolitical risks, as an Iran-linked militant group continues to attack ships around the Red Sea. This has triggered a recovery in WTI, which is trading at $73.82 due to the disruption in oil supplies.
WTI rallies as Iran-linked militant group continues attacking ships in the Red Sea
Crude oil prices extend their recovery to four consecutive days, boosted by a weaker US dollar after the US Federal Reserve (Fed) ended its tightening cycle, hinting that rate cuts are coming in 2024. However, an attack on Norwegian-owned ships and oil shipping companies avoiding the Red Sea is already affecting oil prices.
According to sources cited by Reuters, “the rising geopolitical risk premium, which has manifested itself in the form of periodic hostilities against commercial vessels in the Red Sea by the Iran-backed Houthi rebels, plays its indisputable role in the resurrection of the Petroleum”.
About 15% of global shipping traffic passes through the Suez Canal, the shortest shipping route between Europe and Asia.
Meanwhile, a rise in supply cushioned the rise in WTI on Monday, but Russia and Saudi Arabia, which are extending crude oil production cuts until the first quarter of 2024, are propping up oil prices.
The outlook for WTI remains uncertain due to recent developments, but due to the location of the daily moving averages above the WTI price, it could open the door for further losses. Otherwise, a new escalation in the Middle East area could raise prices and dent the advance of inflation around the world.
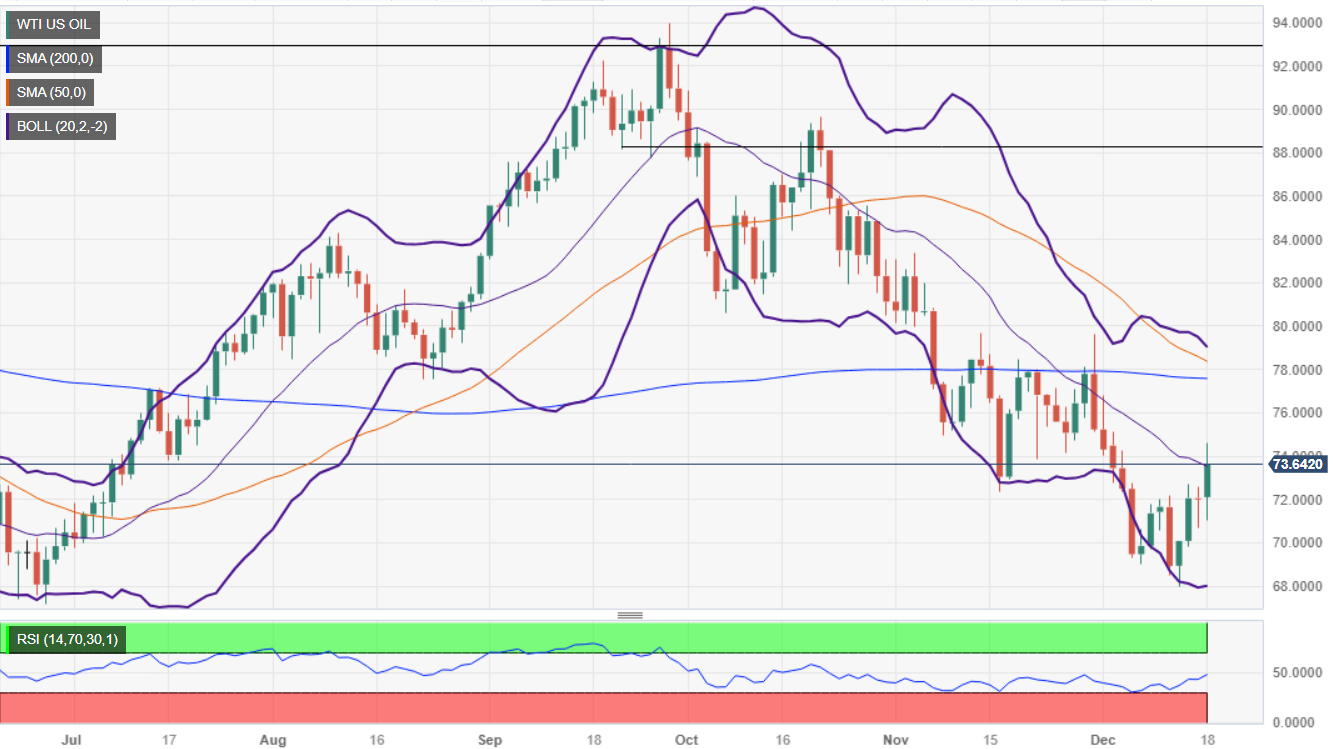
WTI Price Analysis: Technical Perspective
The daily chart shows WTI with a neutral bearish bias, but today’s jump would pave the way for a new trading range within the $72.22-$76.00 zone, before testing the 200-day moving average at $77.72. . On the other hand, achieving a daily close below the last cycle low of November 16 at $72.22 could open the door to a drop to the $70.00 level, followed by the December low at $67.74.
Source: Fx Street
I am Joshua Winder, a senior-level journalist and editor at World Stock Market. I specialize in covering news related to the stock market and economic trends. With more than 8 years of experience in this field, I have become an expert in financial reporting.


")
