
- WTI falls more than 7.50% weekly, registering a new 8-month low.
- S&P global PMIs in September raised fears of a global recession, weighing on WTI.
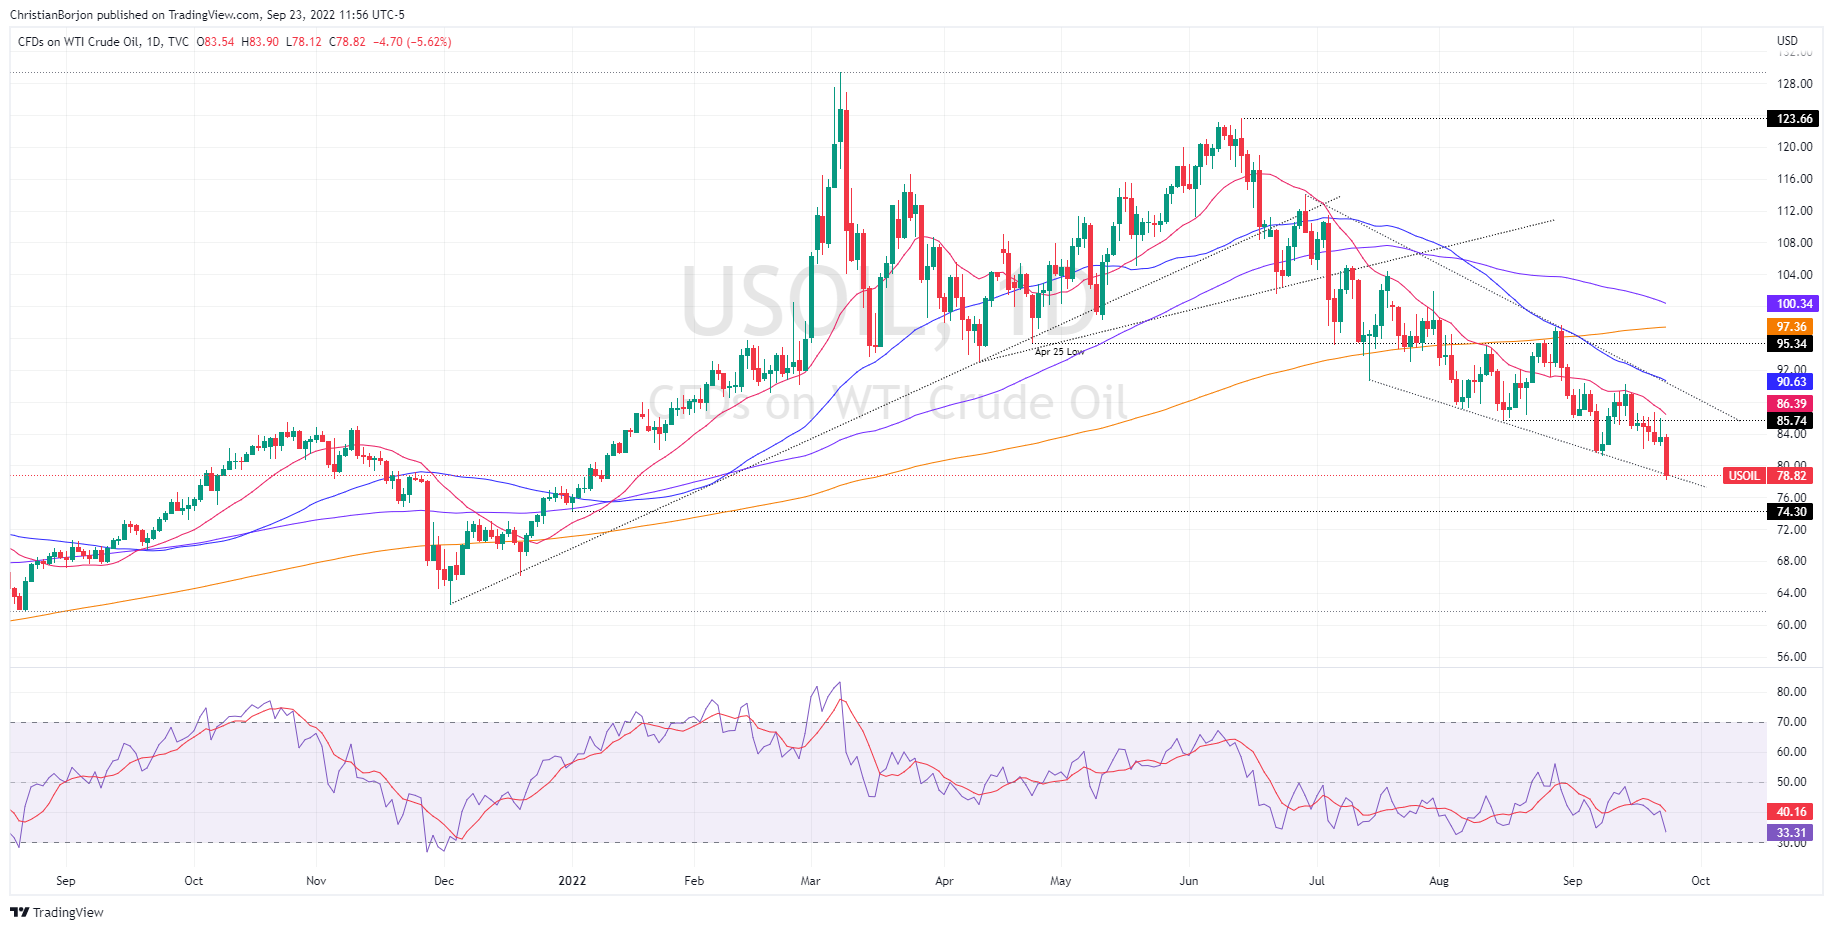
- WTI Price Analysis: A break below $78.00 could pave the way for a drop to $70.00.
The US benchmark oil, also known as WTI, it falls below $80.00 a barrel on Friday, amid a buoyant US dollar, with the dollar index rising to levels last seen in May 2002, a headwind for the dollar-denominated commodity. WTI is therefore trading at $78.80, down almost 6% from its opening price, after reaching a daily high of $83.90.
Throughout the week, WTI is already down 8%, extending its decline to the fourth week in a row. On Wednesday, the US Federal Reserve’s decision to raise rates and emphasize the need for further hikes is weighing on black gold. This, along with the frenzy of other central banks to raise rates, raised recession fears around the world. Therefore, the demand for oil would decrease.
Sources quoted by Reuters said: “The crude oil market is under heavy selling pressure as the US dollar remains on a strong bullish trajectory amid further reduction in risk appetite.”
Meanwhile, sentiment has soured, bolstering the dollar. US stocks fall between 2.13% and 3.44%, extending their weekly losses. By contrast, the Dollar Index, a gauge of the dollar’s value against a basket of peers, is up 1.39% at 112,808, updating two-decade highs.
Recession fears were joined by a section of the S&P global PMIs, revealed during the day. The UK and Eurozone PMIs came in below estimates and were poised to enter a recession, with most indices in contraction territory. By contrast, the US PMIs were mixed, although all three components improved, raising hopes that the US economy could fend off a recession.
In addition, according to a US official, the nuclear agreement with Iran has stalled because Tehran insists on closing the investigations of the UN nuclear watchdog.
WTI Price Analysis: Technical Outlook
The daily chart for WTI shows the price of oil slipping below the lower trend line of a falling wedge, which is usually a bullish sign. Therefore, US Crude Oil could be headed to retest the low of Jan 1, and also last year, at $65.94. However, the Relative Strength Index (RSI) is at 33.25, in negative territory, but not in oversold conditions. Therefore, a break below $75.00 could pave the way to $70 a barrel, on the way to $65.94.
Source: Fx Street
With 6 years of experience, I bring to the table captivating and informative writing in the world news category. My expertise covers a range of industries, including tourism, technology, forex and stocks. From brief social media posts to in-depth articles, I am dedicated to creating compelling content for various platforms.


