
- Gold prices rise on Monday.
- Markets expect Fed rate cut after lackluster data.
- XAU/USD returns to all-time highs.
The pair XAU/USD surpassed $2,100.00 on Monday, as markets lean towards gold bids. Investors are increasing bets on a June rate cut by the Federal Reserve (Fed) after US economic data .US will soften last week.
Markets are rushing to take risk positions ahead of the key Non-Farm Payrolls (NFP) report due out on Friday. Markets expect weaker jobs data to add to the rate-cutting puzzle, and broader market hopes for a weakening US economic outlook are crystallizing into XAU/USD buying.
The US February ADP Employment Change will also be released this week in advance of Friday's NFP employment data, albeit with a shaky connection in recent history. Fed Chair Jerome Powell will also speak on Wednesday, testifying before the Financial Services Committee on the Semi-Annual Monetary Policy Report starting at 15:00 GMT.
US economic data will begin the week on Tuesday with the ISM Services Purchasing Managers' Index for February expected to soften to 53.0 from 53.4 in January.
Gold is extending last Friday's gains, surpassing the $2,100.00 area in early trading of the week. XAU/USD is up more than a percentage point top-to-bottom on Monday, and intraday bids are accelerating at the upper end away from the 200-hour SMA at $2,038.89.
Daily candlesticks are approaching all-time highs set in December at $2,144.48, and XAU/USD is up about 4% from last week's bid lows near $2,025.00.
XAU/USD hourly chart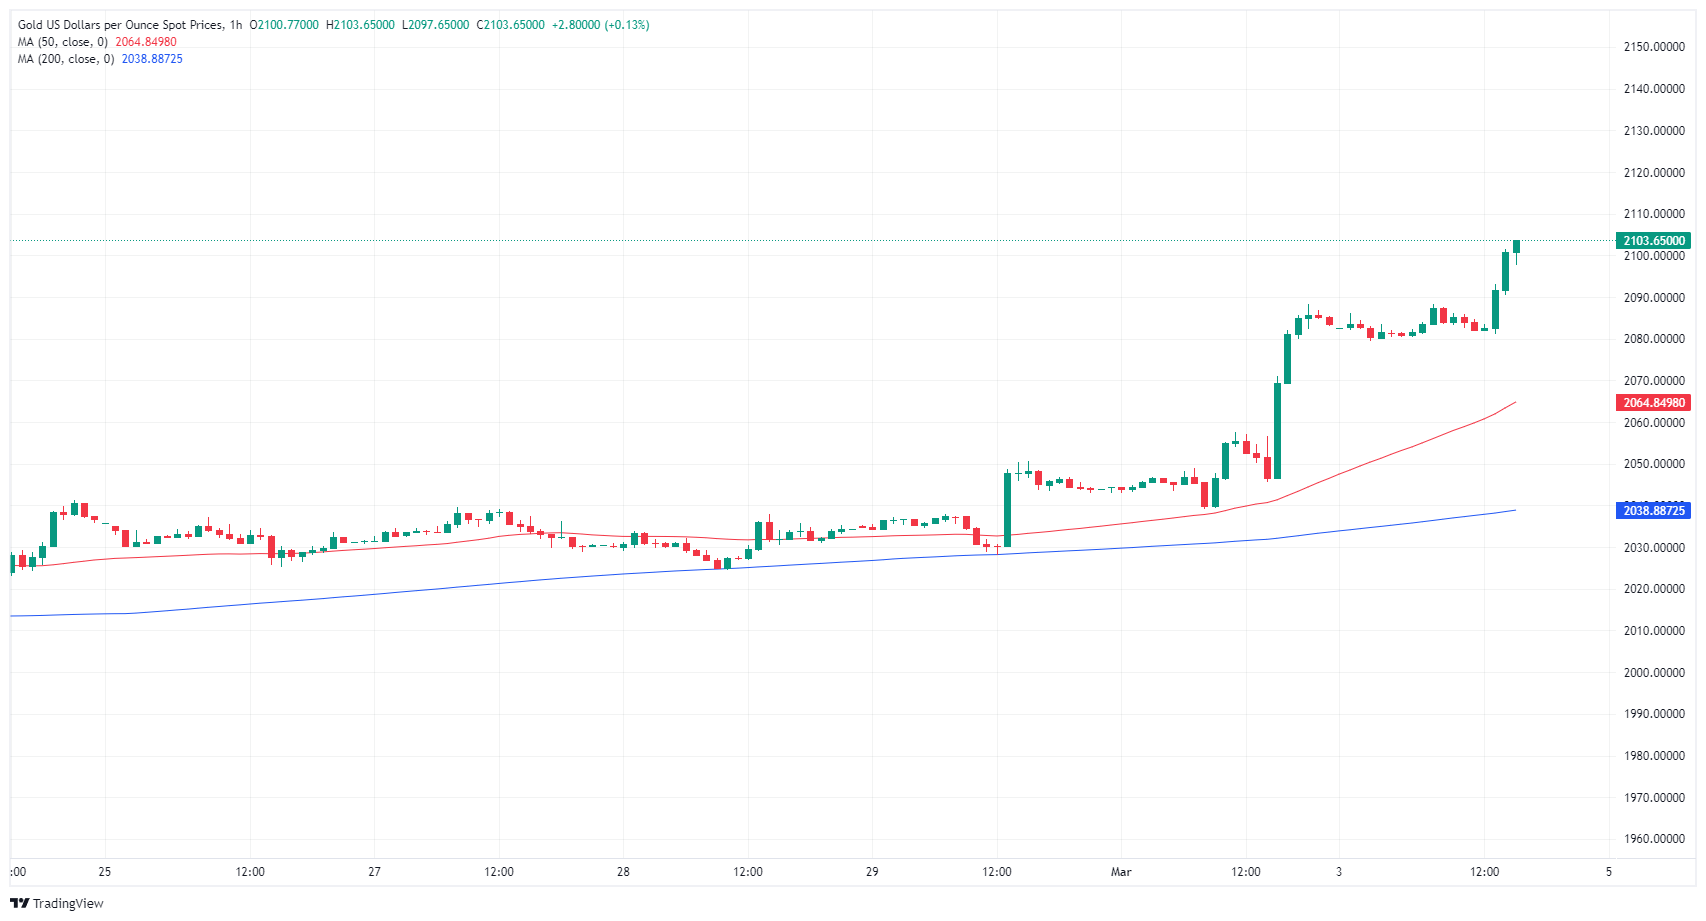
XAU/USD daily chart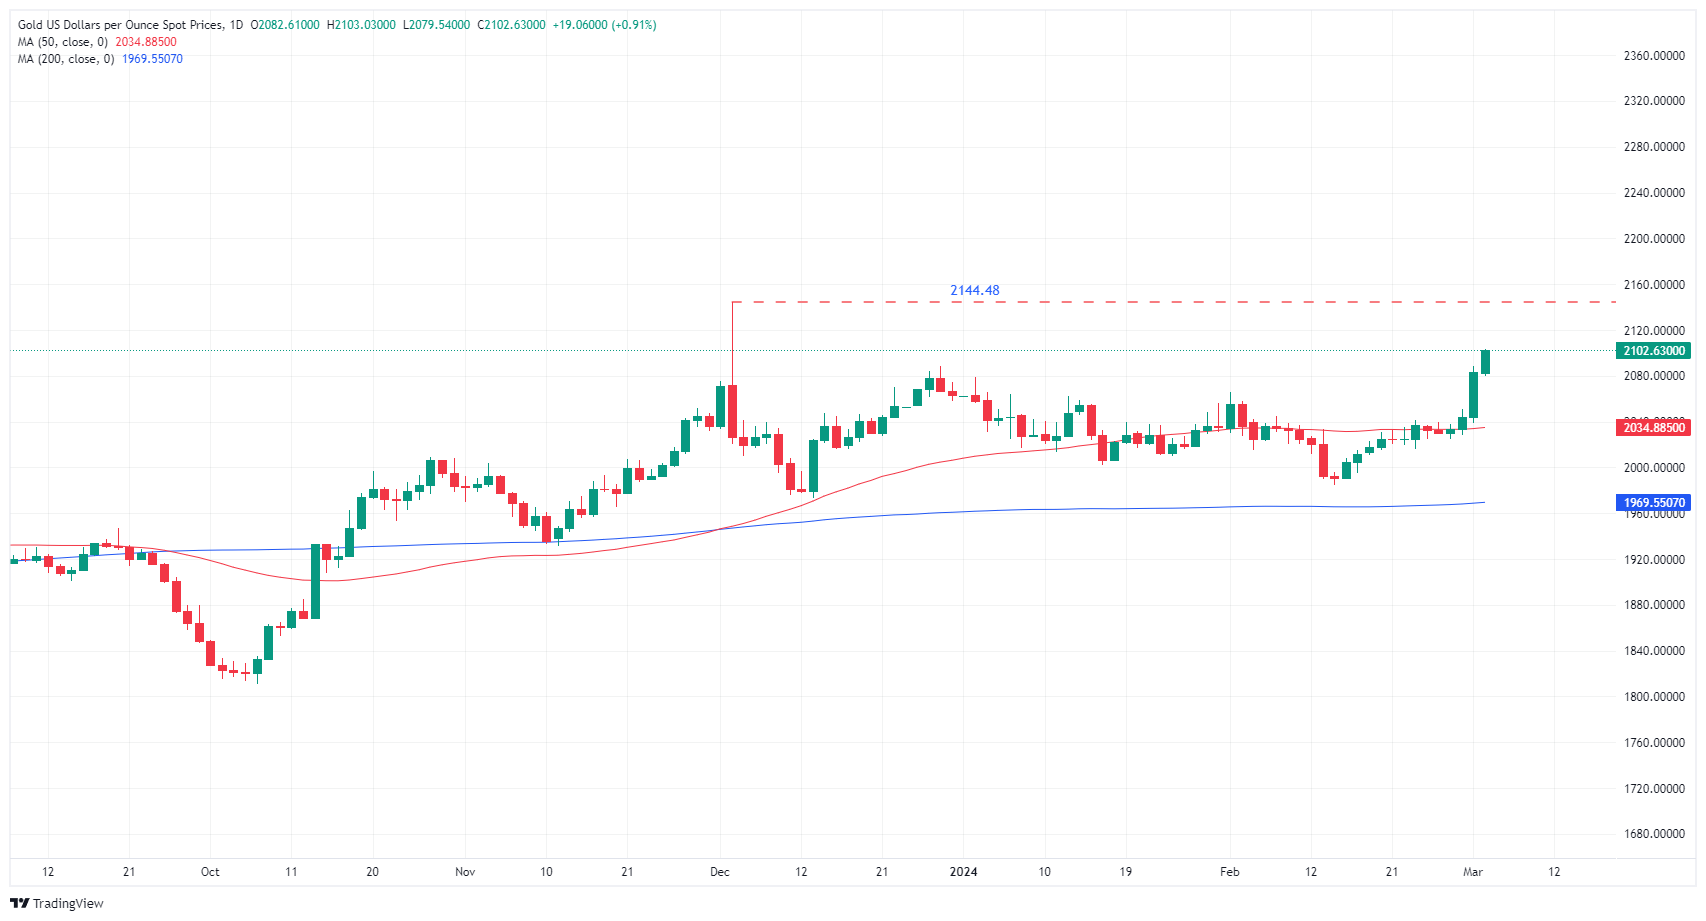
Source: Fx Street
I am Joshua Winder, a senior-level journalist and editor at World Stock Market. I specialize in covering news related to the stock market and economic trends. With more than 8 years of experience in this field, I have become an expert in financial reporting.


