
- The AUD/JPY pair is trading at 98.04, up 0.12% during Monday's session.
- The RSI on both the daily and hourly charts is in the positive zone, but the momentum is limited.
- The overall trend remains bullish as buyers reclaimed the 20-day SMA.
In Monday's session, the AUD/JPY pair is trading at 98.04, reflecting a rise of 0.12%. Despite a slight decline in buying momentum, there is an overall moderate bullish sentiment dominating the market as indicators appear to be recovering after recent declines.
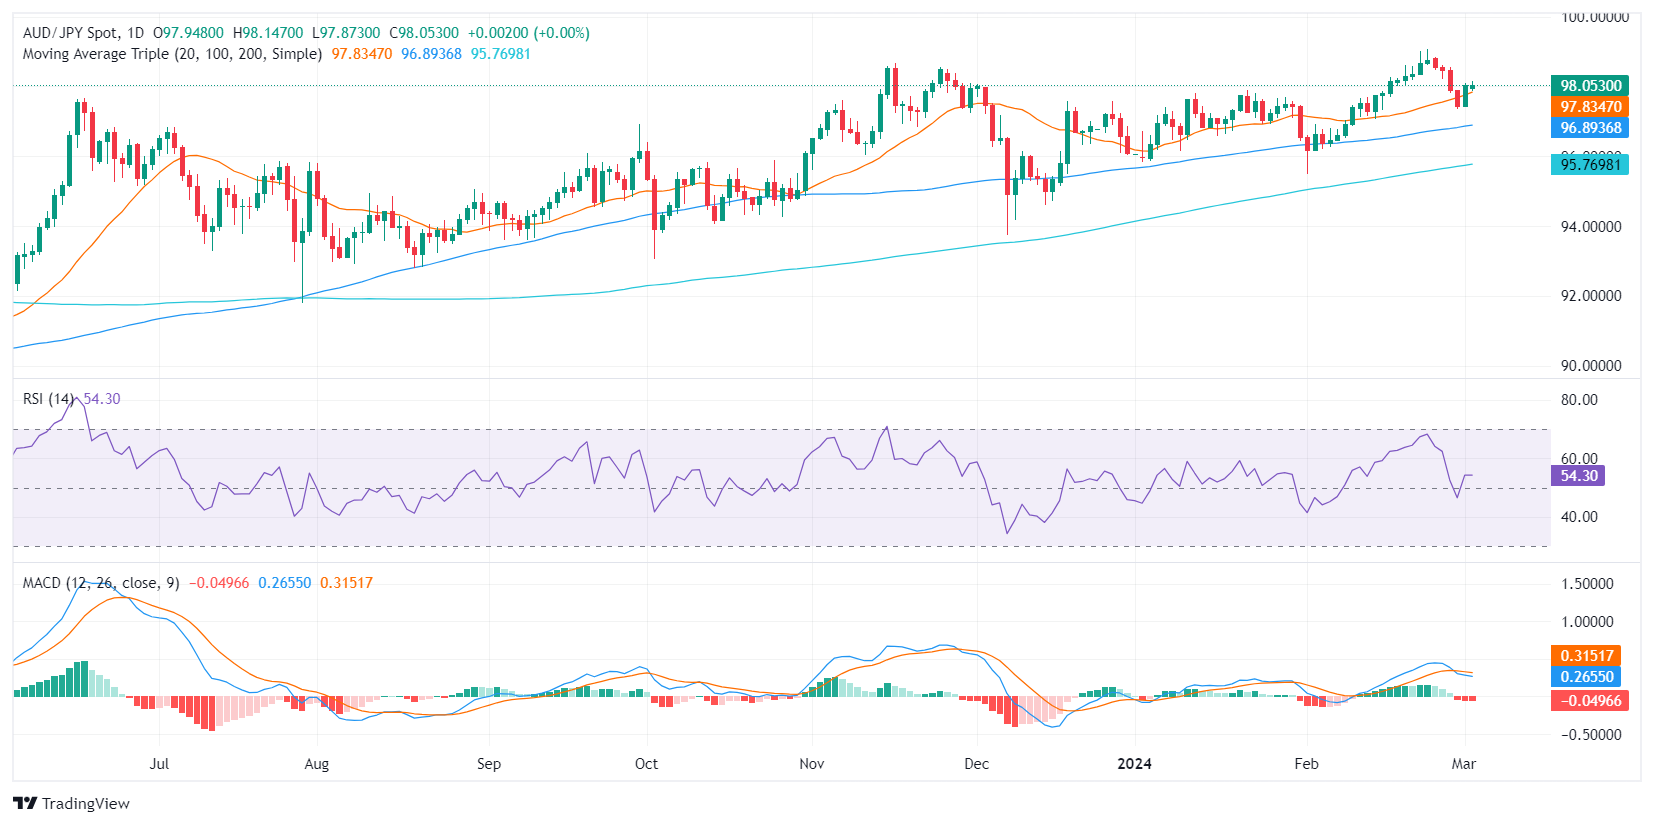
On the daily chart, the AUD/JPY relative strength index (RSI) is in positive territory, indicating that buyers have had the upper hand recently after falling below 50. Despite slight declines in Latest readings, there is still moderate bullish momentum. The moving average convergence divergence (MACD) histogram shows flat red bars, suggesting a loss of positive momentum but still slightly bullish sentiment in the market.
AUD/JPY daily chart
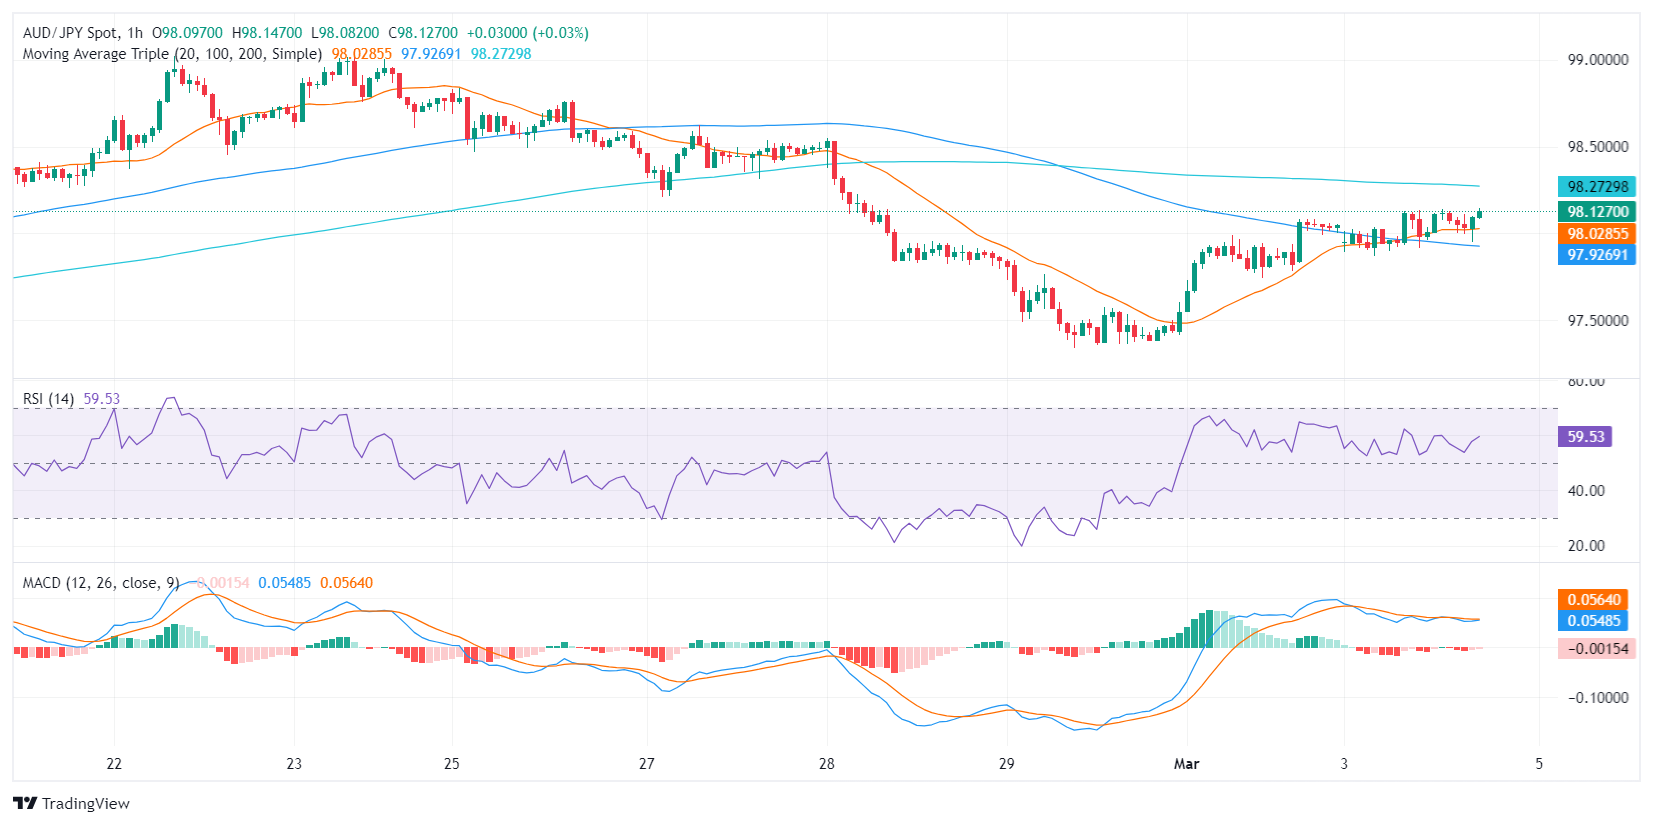
Turning to the hourly chart, the RSI values present a similar picture, hovering in positive territory, and the MACD histogram continues with decreasing red bars, indicating a loss of selling momentum but a flattened buying traction. These readings imply that the pair is experiencing similar short-term dynamics.
AUD/JPY hourly chart
When contrasting the daily and hourly charts, the indicators suggest a constant bullish momentum, although with less intensity. Despite the neutral to negative near-term outlook, the pair's position above the 20-day, 100-day, and 200-day SMA reinforces the view that buyers are in control in the broader market view. .
Source: Fx Street
I am Joshua Winder, a senior-level journalist and editor at World Stock Market. I specialize in covering news related to the stock market and economic trends. With more than 8 years of experience in this field, I have become an expert in financial reporting.


