
- The AUD/JPY fell sharply by more than 1.50%.
- The RSI fell steadily from the deep overbought region to its midpoint.
During Thursday’s trading session, the AUD/JPY pair experienced steep losses towards 107.30. Overall, the pair is taking a pause as buyers are holding back, and given the pair’s situation in the multi-year context, the likelihood of further corrections is imminent. However, the indicators escaped overbought conditions, which is healthy for the pair.
On the daily view, the Relative Strength Index (RSI) for AUD/JPY plunged to almost 56, not stopping from the 70 threshold. At the same time, the Moving Average Convergence/Divergence (MACD) indicator shows a pattern of declining green bars, mimicking a decline in the existing bullish momentum.
AUD/JPY daily chart
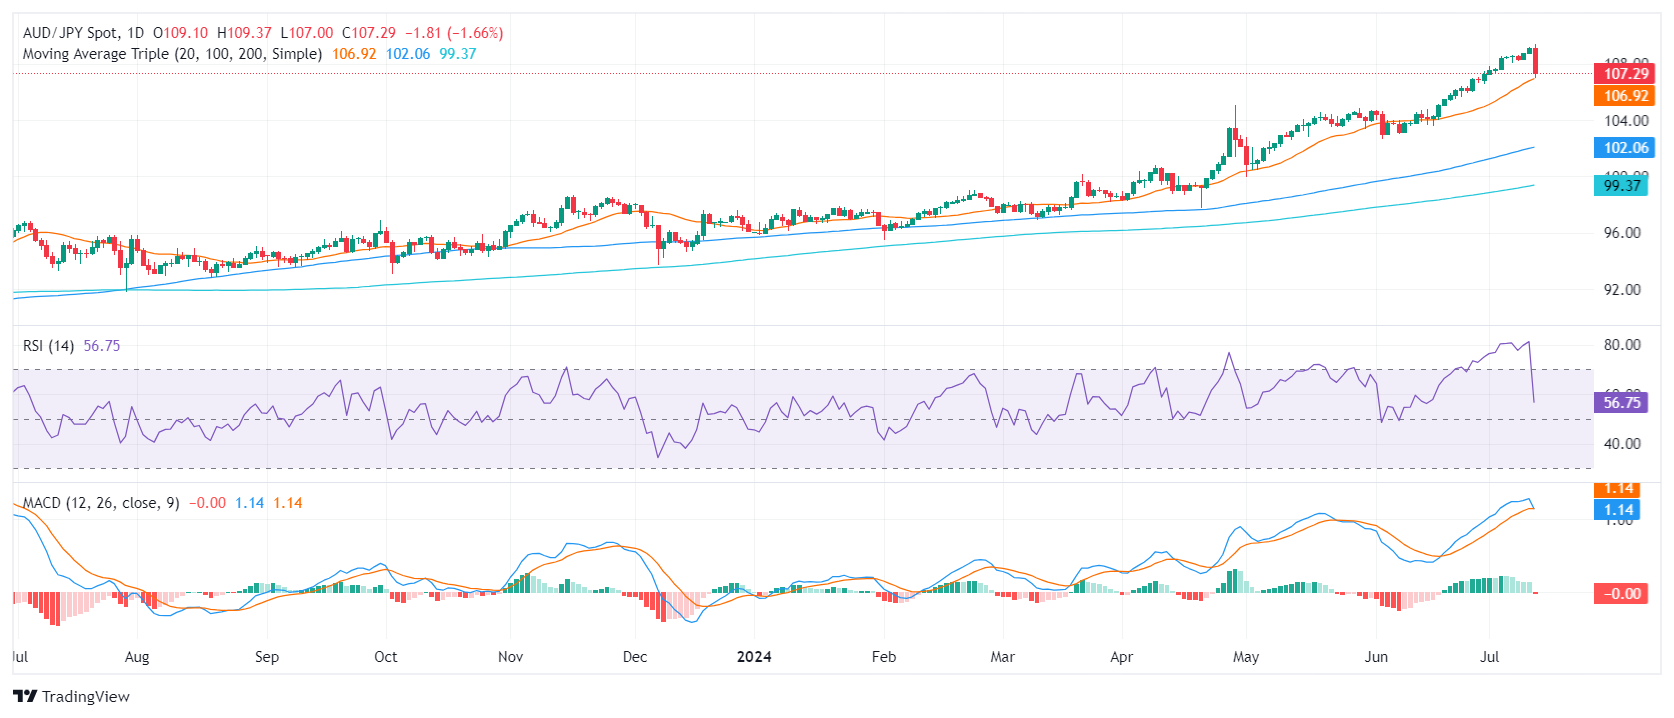
From a broader perspective, the AUD/JPY pair continues to show signs of a potent bullish sentiment supported by its position at multi-year highs and above its major simple moving averages (SMAs). In case of further pullbacks, several key supports line up below 107.00 where the 20-day SMA converges. The 106.50 and 106.00 levels could come into play to limit losses. However, if the pair maintains the buying interest, it could look for a retest around the 107.00-109.00 area.
Source: Fx Street
I am Joshua Winder, a senior-level journalist and editor at World Stock Market. I specialize in covering news related to the stock market and economic trends. With more than 8 years of experience in this field, I have become an expert in financial reporting.


