
- AUD/USD could test the upper boundary of the ascending channel around the level of 0.6785.
- The 14-day RSI is positioned slightly below the 70 level, indicating possible overbought conditions and an upcoming correction.
- Key support appears at the lower border of the ascending channel around the level of 0.6675.
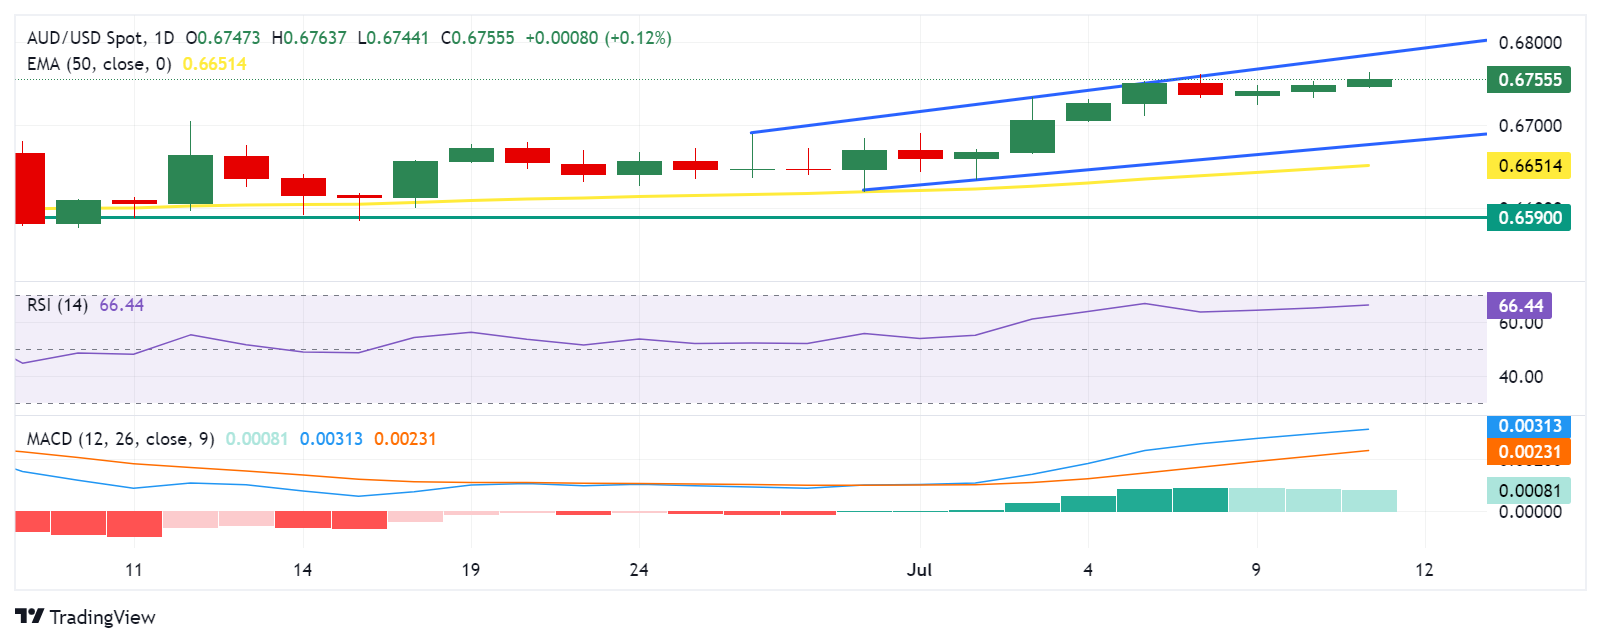
The AUD/USD pair is extending its losses for the third consecutive day, trading around 0.6760 during the European hours on Thursday. The daily chart analysis shows that the AUD/USD pair is consolidating within an ascending channel, indicating a bullish bias in the pair’s price action.
Additionally, the 14-day Relative Strength Index (RSI) is positioned slightly below the 70 level, indicating confirmation of the uptrend while also suggesting possible overbought conditions. A break above this level could signal the need for caution, possibly indicating an upcoming correction.
Moreover, the Moving Average Convergence Divergence (MACD) momentum indicator is above the center line, suggesting an upward price movement. The divergence above the signal line further confirms this bullish trend as it indicates an increase in positive momentum.
The AUD/USD pair could test the upper boundary of the ascending channel at around 0.6785. If it breaks this level, the pair could aim for the psychological level of 0.6800.
On the downside, the AUD/USD pair could find support around the lower boundary of the ascending channel at the 0.6675 level, with additional support near the 50-day exponential moving average (EMA) at 0.6651. A break below this level could push the pair towards the retracement support around 0.6590.
AUD/USD: Daily Chart
Australian Dollar PRICE Today
The table below shows the Australian Dollar (AUD) exchange rate against major currencies today. The Australian Dollar was the strongest currency against the Canadian Dollar.
| USD | EUR | GBP | JPY | CAD | AUD | NZD | CHF | |
|---|---|---|---|---|---|---|---|---|
| USD | -0.08% | -0.16% | -0.06% | 0.10% | -0.13% | -0.11% | -0.10% | |
| EUR | 0.08% | -0.07% | 0.04% | 0.21% | -0.03% | -0.02% | -0.01% | |
| GBP | 0.16% | 0.07% | 0.10% | 0.28% | 0.04% | 0.04% | 0.07% | |
| JPY | 0.06% | -0.04% | -0.10% | 0.15% | -0.07% | -0.09% | -0.04% | |
| CAD | -0.10% | -0.21% | -0.28% | -0.15% | -0.25% | -0.22% | -0.21% | |
| AUD | 0.13% | 0.03% | -0.04% | 0.07% | 0.25% | 0.00% | 0.04% | |
| NZD | 0.11% | 0.02% | -0.04% | 0.09% | 0.22% | -0.01% | 0.03% | |
| CHF | 0.10% | 0.01% | -0.07% | 0.04% | 0.21% | -0.04% | -0.03% |
The heatmap shows percentage changes of major currencies. The base currency is selected from the left column, while the quote currency is selected from the top row. For example, if you choose the Australian Dollar from the left column and move along the horizontal line to the US Dollar, the percentage change shown in the chart will represent the AUD (base)/USD (quote).
Source: Fx Street
I am Joshua Winder, a senior-level journalist and editor at World Stock Market. I specialize in covering news related to the stock market and economic trends. With more than 8 years of experience in this field, I have become an expert in financial reporting.


