
- AUD/USD finds temporary support near 0.6500, although the downtrend remains favorable.
- The RBA's high interest rates have exacerbated Australia's cost of living crisis.
- US Dollar retreats from six-week highs despite upward revision to fourth-quarter GDP estimates.
The AUD/USD pair finds support slightly below the 0.6500 psychological support in the early hours of the American session on Thursday. The pair discovers some buying interest as the US dollar retreats after refreshing six-week highs. However, the overall appeal of the Australian asset remains bearish as investors remain uncertain ahead of US Personal Consumption Expenditure (PCE) Price Index data for February, due out on Friday.
He PCE underlying will give clues about when the Federal Reserve (Fed) will begin to reduce interest rates. It is estimated that the annual core inflation figure has grown steadily by 2.8%, with monthly growth that has fallen to 0.3% from 0.4% in January.
The US Dollar Index failed to hold six-week highs near 104.72 even though the US Bureau of Economic Analysis (BEA) final estimate for the final quarter of 2023 shows the economy growing by 3.4%. According to preliminary estimates, the economy grew by 3.2%.
Meanwhile, the Australian dollar continues to decline, as the Reserve Bank of Australia's (RBA) rise in the official interest rate has aggravated the cost of living crisis. The Australian Bureau of Statistics reported that monthly retail sales grew at a slower pace of 0.3% in February, compared to expectations of 0.4% and the previous reading of 1.1%.
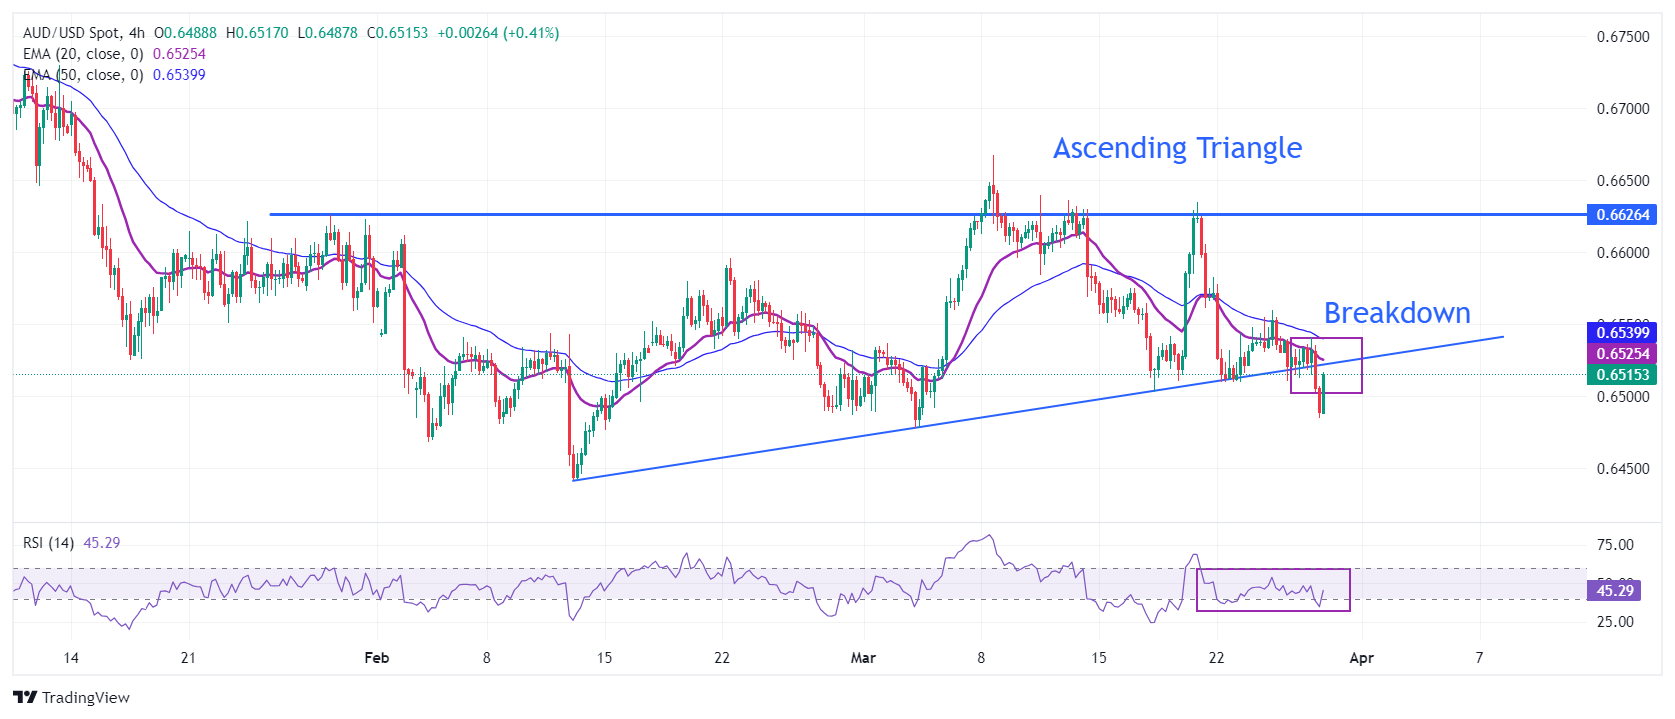
The AUD/USD pair is expected to test the breakout of the ascending triangle chart pattern formed near 0.6520 on a four-hour time frame. The upward limit of this pattern is drawn from the low of February 13 at 0.6442, while horizontal resistance is located from the high of January 30 at 0.6626.
The bearish 20- and 50-period exponential moving averages (EMAs) at 0.6525 and 0.6538, respectively, indicate that short-term demand is weak.
The 14-period Relative Strength Index (RSI) is oscillating within the range of 40.00-60.00, indicating indecision among market participants.
Investors could take short positions after a pullback towards 0.6530. Profits from short positions would be taken near the psychological support of 0.6500 and the February 13 low near 0.6440.
On the contrary, a strong recovery above the March 26 high at 0.6560 will push the asset towards the round resistance of 0.6600, followed by the March 12 high at 0.6640.
AUD/USD four-hour chart
Source: Fx Street
I am Joshua Winder, a senior-level journalist and editor at World Stock Market. I specialize in covering news related to the stock market and economic trends. With more than 8 years of experience in this field, I have become an expert in financial reporting.


