
- AUD/USD is about to end the week with losses of 1.10%.
- A bearish candlestick pattern and the RSI crossing below 50 are two reasons that could push AUD/USD lower.
- AUD/USD sellers are eyeing a break below 0.6900 on its way to 0.6800.
The AUD/USD falls substantially, courtesy of encouraging US economic data, which saw the major currency slump from daily highs around 0.6974 towards daily lows at 0.6869, though as Wall Street closed the Aussie pulled back some of those losses. At the time of writing, the AUD/USD is trading at 0.6910, down 0.82%.
AUD/USD Price Analysis: Technical Outlook
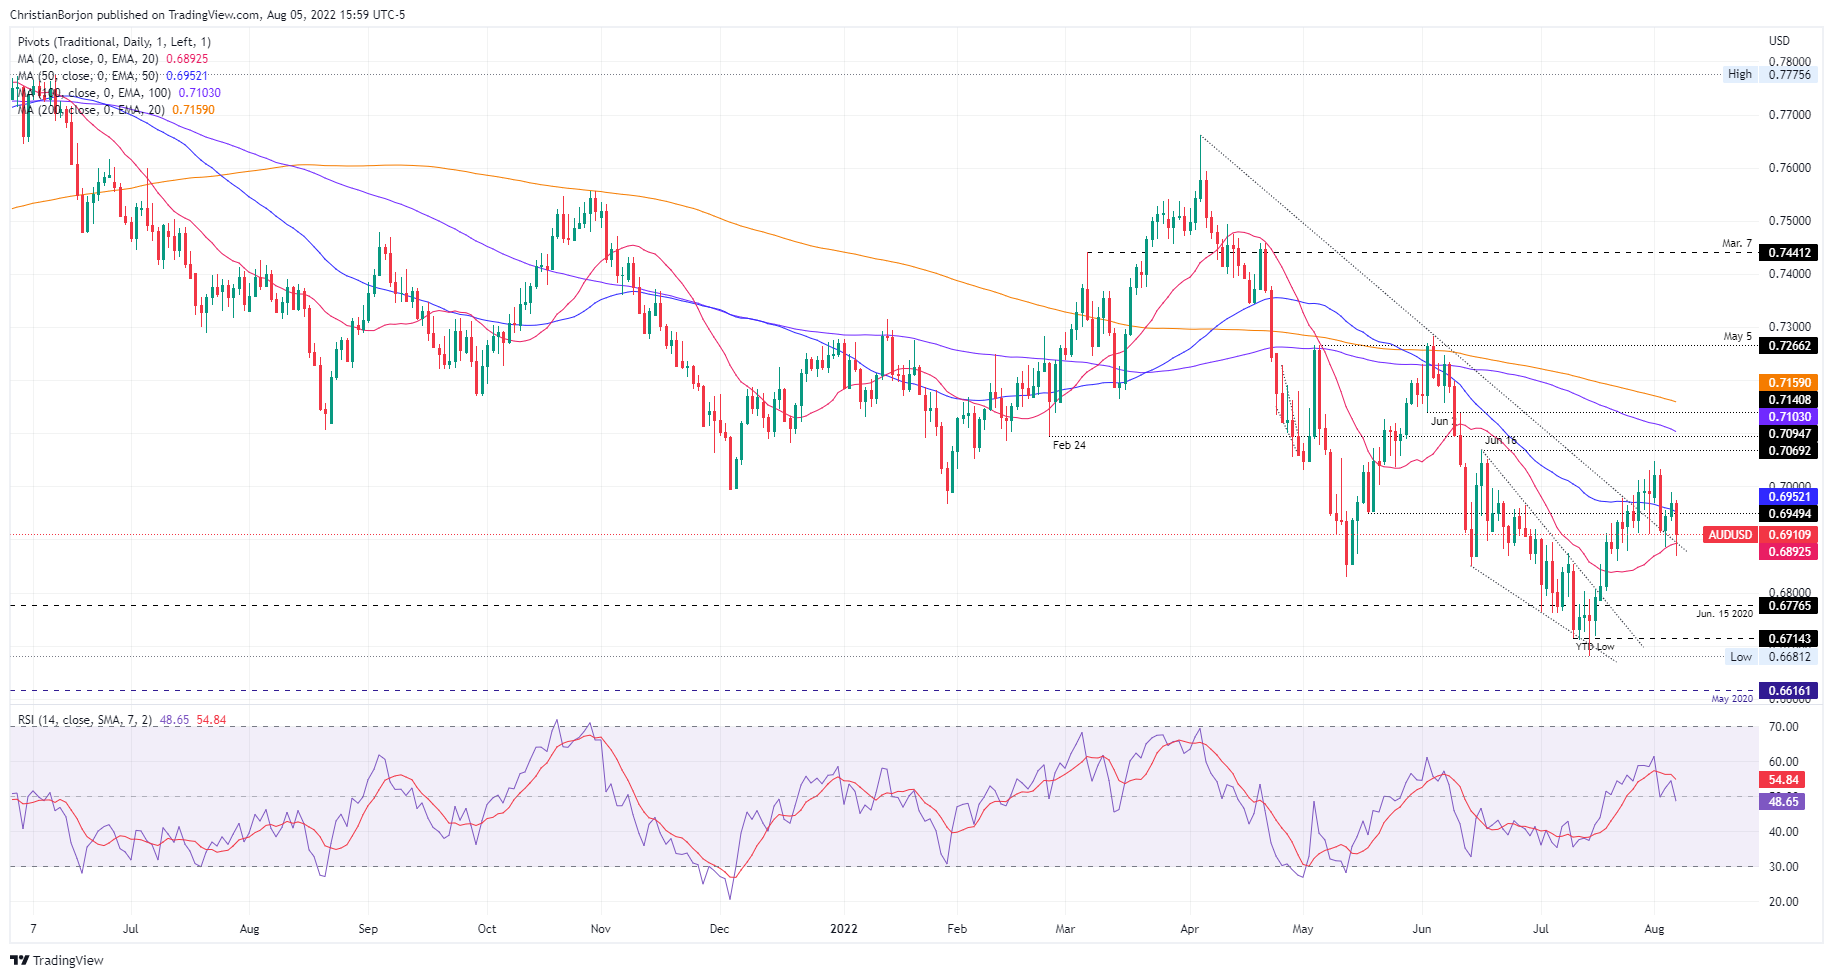
The daily chart of AUD/USD shows the pair below the confluence of the August 4 low and the 50-day EMA around 0.6952. It is worth noting that earlier, the major dipped below the intersection of a 5-month downtrend line and the 20-day EMA around 0.6892, but was short-lived and bounced back towards the current trading level.
Still, AUD/USD has a bearish bias for a few reasons: Firstly, the Relative Strength Index (RSI) has just crossed below the 50 mid-line, indicating that the sellers are gaining momentum. And the second reason would be that the last two daily candles formed a bearish engulfing candlestick pattern, which implies that the sellers outperformed the buyers.
Therefore, the path of least resistance for AUD/USD is to the downside, and the first support for the pair would be 0.6900. Once above, the next stop will be the 20-day EMA at 0.6892, followed by the 0.6800 mark.
Technical levels
Source: Fx Street
With 6 years of experience, I bring to the table captivating and informative writing in the world news category. My expertise covers a range of industries, including tourism, technology, forex and stocks. From brief social media posts to in-depth articles, I am dedicated to creating compelling content for various platforms.


