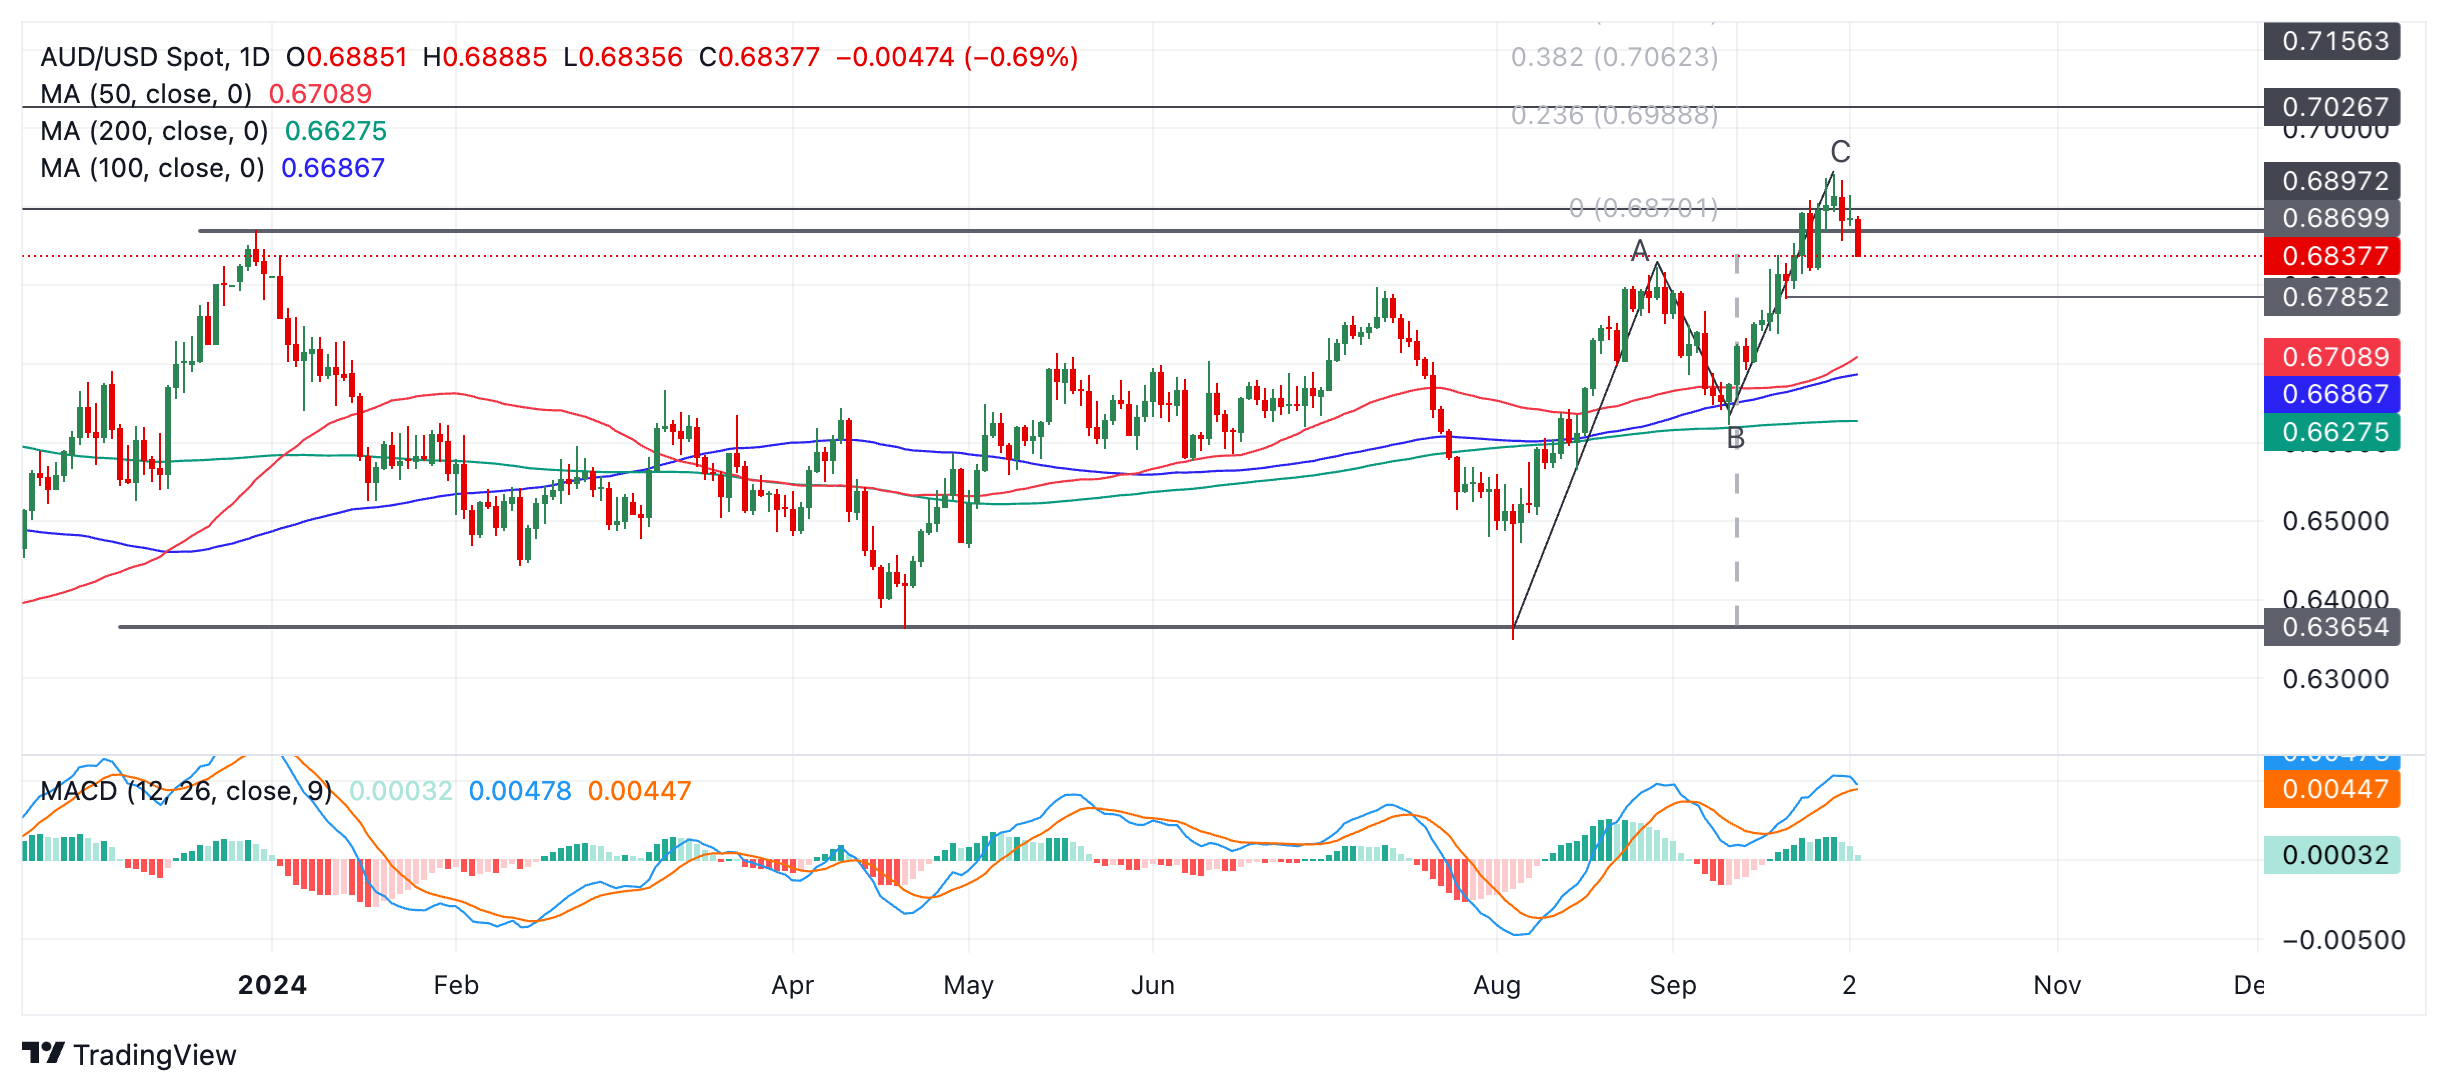
- AUD/USD stops at the upside resistance and reverses lower, returning to its range.
- It is threatening a short-term trend reversal and the MACD is about to cross below its signal line.
AUD/USD reverses and begins to fall after what appears to be a false break above the top of the range.
AUD/USD daily chart
The Australian pair has started to fall back into the range. It is possible that this could be the start of a new short-term downtrend that could take AUD/USD back towards the lows of the range at 0.63, however, it is still too early to say for sure.
The blue MACD line is threatening to cross below the red signal line and if it does, it would add more evidence to the argument that AUD/USD is reversing its trend.
AUD/USD may have formed a Measured Movement pattern during August and September as it rose from the bottom to the top of the range. Such patterns resemble zigzags and the lengths of waves A and C are similar or related by Fibonacci.
The Australian pair reached an initial upside target based on the extrapolation of wave A of the Measured Move Up by 61.8% Fibonacci. This target is located around 0.6115. This is further evidence that the uptrend may have reached its zenith and a new downtrend is currently forming. For further confirmation, the price would have to break below the 0.6785 level (September 20 low). Such a move would be expected to hit an initial downside target of 0.6709, the 50-day SMA level.
Until then, there is still a risk that the downward movement stops and the uptrend resumes, taking AUD/USD back higher. A break above the September 30 peak at 0.6942 would confirm a resumption of the uptrend and target 0.6988 (February 14, 2023 high), followed by 0.7156 in a bullish case (February 2, 2023 high).
Source: Fx Street
I am Joshua Winder, a senior-level journalist and editor at World Stock Market. I specialize in covering news related to the stock market and economic trends. With more than 8 years of experience in this field, I have become an expert in financial reporting.


