
- The Aussie is among the best results on Friday.
- AUD/USD pullback from near 0.6880 found support at 0.6820.
- AUD/NZD hits 1-week highs around 1.1200.
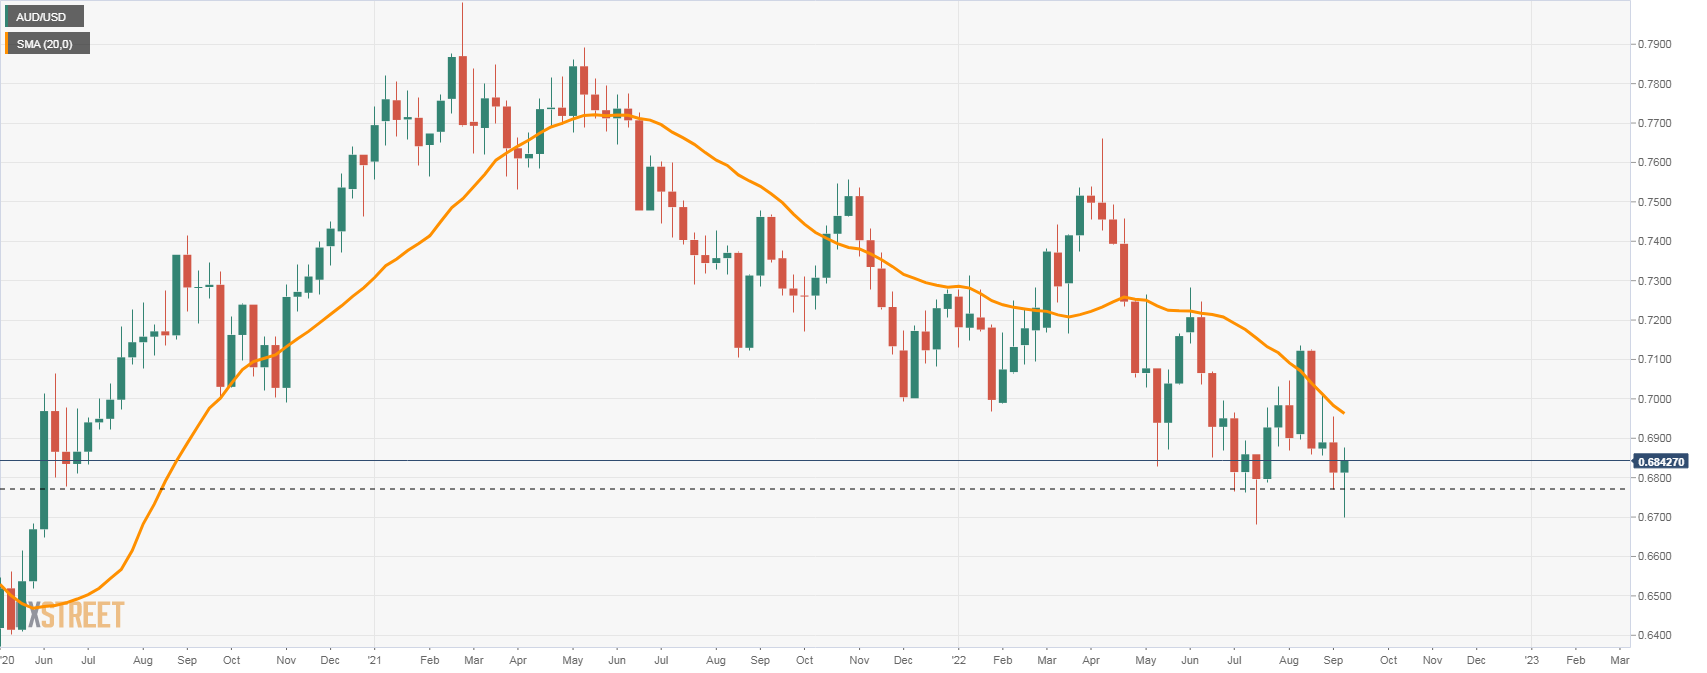
The AUD/USD reached a high during the European session at 0.6877, the highest level since August 31, and then pulled back amid a stabilization of the USD. The pullback found support at 0.6820 and the pair is about to end the week with gains.
A broad US dollar correction and rising commodity and equity prices are helping the Aussie confirm weekly gains. The Australian dollar is among the top performing currencies on Friday. Against the kiwi it hit one-week highs, with AUD/NZD testing levels above 1.1200.
In weekly terms, AUD/USD has managed to bounce back below 0.6700 and is about to end the week with gains. Most importantly, it is avoiding a weekly close below 0.6770 which would have been the lowest since 2020, opening the doors to new lows.
Inflation and employment
Next week there will be two critical reports for the AUD/USD pair. In the US, it will be August inflation on Tuesday. The figures will have critical implications for market expectations regarding the upcoming Federal Reserve meeting. Powell maintained his hawkish stance during the week, although a slowdown in the annual inflation rate could start to ease rate hike expectations, not necessarily for the September FOMC meeting.
Australian labor market data will be released on Thursday. After a disappointment in July, the August report is expected to show improvement. The market consensus is that there will be an increase of 35,000 jobs. Another weak figure could weigh on the aussie as market participants would see a 25 basis point rate hike by the Reserve Bank of Australia as more likely than a larger hike.
AUD/USD weekly chart
Technical levels
Source: Fx Street
With 6 years of experience, I bring to the table captivating and informative writing in the world news category. My expertise covers a range of industries, including tourism, technology, forex and stocks. From brief social media posts to in-depth articles, I am dedicated to creating compelling content for various platforms.


