
- AUD/USD is gaining close to 1.50% on Thursday.
- Sentiment is mixed, as Asian and European stocks closed in the negative, while US equities match Wednesday’s losses.
- The Fed’s Esther George said the “tough week in equity markets” would not alter her support for 50 basis point hikes.
- AUD/USD Price Forecast: A daily close above 0.7050 could send the pair towards 0.7100.
The AUD/USD is paring Wednesday’s losses and rallying strongly, up over 1.40% on Thursday, despite the market being unwilling to take risks, which would normally be a headwind for the pair. At 0.7052, AUD/USD reflects ongoing US dollar weakness in the North American session, influenced by mixed US economic data and falling US Treasury yields.
Sentiment fluctuates, courtesy of China’s concerns about further lockdowns; despite this, the AUD/USD rises
Market sentiment is mixed, courtesy of weak US corporate earnings and high inflationary pressures, which hit big US retailers like Walmart and Target, although US retail sales showed resilience from the consumers. Furthermore, China remains under pressure as provinces reported local outbreaks of Covid-19, raising concerns about more lockdowns. Meanwhile, the conflict between Ukraine and Russia looms over us, although it has receded into the background.
In the Asian session, the Australian docket featured employment data, which showed full-time employment in April rose by 92,400, beating expectations of 20,000 new jobs. In contrast, the Part Time figures plummeted to -88.4000. However, in both statistics, the Australian economy added 4,000 jobs, and it is also worth noting that the unemployment rate fell to 3.9% from 4%.
Analysts at ANZ bank wrote in a note that “combined with yesterday’s disappointing wage data, this suggests that a 25bps cash rate hike at the June RBA meeting is more likely than a 40-50 basis points.”
The statements of the different members of the Fed continue on Thursday
On the other hand, the US economic calendar also presented data. The Labor Department reported that initial jobless claims for the week ending May 14 unexpectedly rose to 218,000, higher than the forecast 200,000. At the same time, the Philadelphia Fed manufacturing index rose to 2.6, well below the estimated 17.6, after the New York Fed’s Empire State index fell, which fell to 11.6, painting a dismal figure for the US ISM for June.
Meanwhile, Fed spokespeople continue to dominate the headlines. Today, the president of the Kansas City Fed, Esther George, affirmed that the “tough week in the stock markets” does not alter her support for increases of 50 basis points to cool inflation. She added that “right now, inflation is too high, and we will have to make a series of rate adjustments to bring it down.”
On Wednesday, Philadelphia Fed President Patrick Harker declared that the Fed “doesn’t want to go overboard” and commented that the US could have a few quarters of negative growth, but it’s not what he expects.
AUD/USD Price Forecast: Technical Outlook
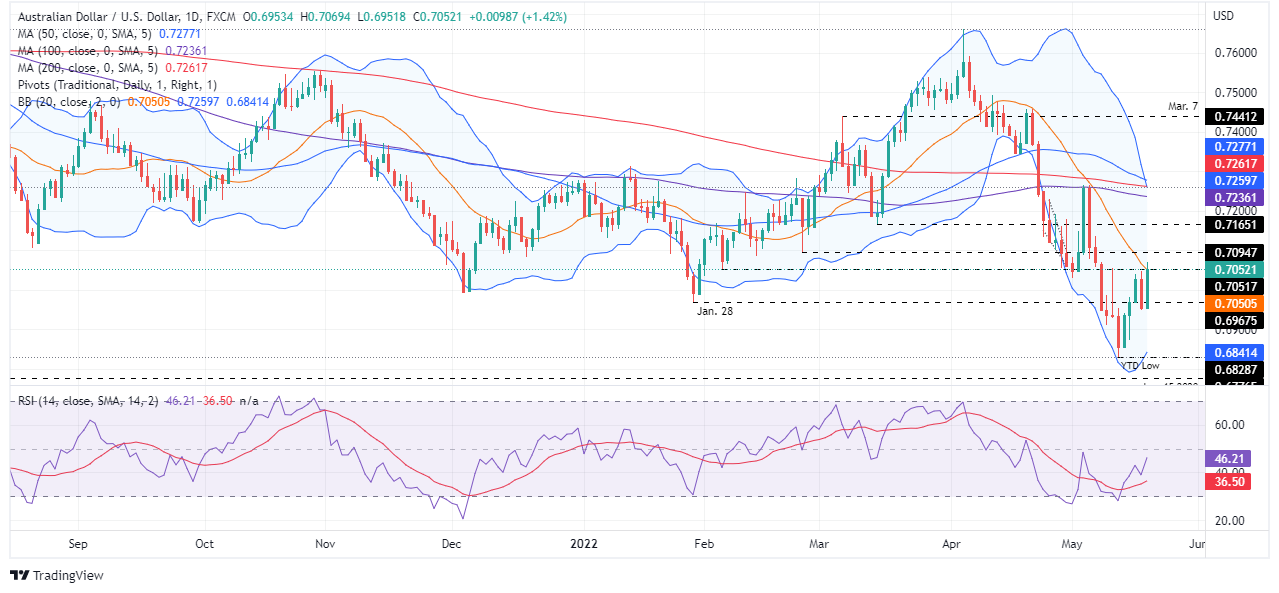
AUD/USD remains in a bearish bias, despite bouncing back and breaking through the confluence of the May 11 high and the 20-day moving average (DMA) at 0.7051. The above is reinforced by the fact that the Relative Strength Index (RSI), although pointing to the upside, is in bearish territory, which means that unless it crosses the mid-50 line, that will open the door to additional buying pressure on the pair.
To the upside, AUD/USD’s first resistance would be the Feb 24 low turned resistance at 0.7094. A break above would expose the May 6 daily high at 0.7135, followed by the March 15 low at 0.7165. On the other hand, the first support for the AUD/USD would be the 50 DMA at 0.7050. A break of the latter would expose essential support levels such as the 0.7000 figure, followed by the Jan 23 swing low at 0.6967 and then the YoY low at 0.6828.
Technical levels
Source: Fx Street
With 6 years of experience, I bring to the table captivating and informative writing in the world news category. My expertise covers a range of industries, including tourism, technology, forex and stocks. From brief social media posts to in-depth articles, I am dedicated to creating compelling content for various platforms.


