
- AUD/USD wavers around 0.6375 as markets digest Fed decision.
- Fed keeps rates at 5.25%, Powell says no decisions at future meetings.
- Coming soon: Australian trade balance for September, US NFP for Friday.
The pair AUD/USD moves in a mid-range on Wednesday, after the US Federal Reserve (Fed) kept its monetary policy rates at 5.25-5.5%, and markets will focus on US Non-Farm Payrolls (NFP) on Friday.
The Australian Dollar (AUD) bounced against the US Dollar (USD) during the first trading day of November, rising from an initial low at 0.6318 to hit an intraday high of 0.6394 and is now trading in the middle of the range near 0.6360 .
The US Fed held rates steady, as many market participants expected, but the notable lack of change in the Fed’s rate statement is scuppering the market’s initial bets of a final rate hike for 2023 in December.
Investors expect a slight reduction in the Australian trade balance from 9.64 billion to 9.4 billion.
Next, the broader market will look to Friday’s US NFP release, which will have additional weight now that the Fed has steered its forecasts to be limited to short-term data.
Job growth is expected to slow but remain positive for the US, with Friday’s NFP expected to bring in 180,000 jobs in October, down from 336,000 in September.
AUD/USD Technical Outlook
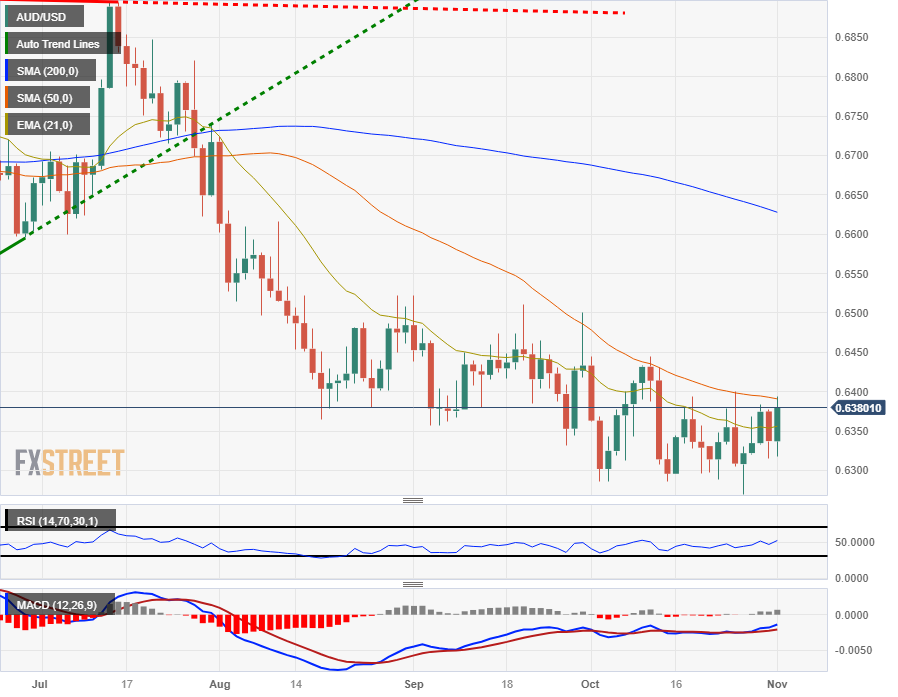
The Australian Dollar continues to face technical resistance near the 0.6400 area, as the 50-day SMA acts as a ceiling on the price action near 0.6390, and the pair moves strongly in the midrange around the 21-day exponential moving average (EMA).
AUD/USD bids remain firmly stuck in the medium-term bearish zone, and a bearish continuation through the 0.6300 zone will see the pair hit twelve-month lows below 0.6270.
AUD/USD Daily Chart
AUD/USD Technical Levels
Source: Fx Street
I am Joshua Winder, a senior-level journalist and editor at World Stock Market. I specialize in covering news related to the stock market and economic trends. With more than 8 years of experience in this field, I have become an expert in financial reporting.


