
- The AUD/USD pair retreats to the middle zone on Wednesday.
- Australian jobs data due early Thursday will give Australian traders pause.
- US data was mixed on Wednesday, and the Dollar failed to advance.
AUD/USD retreats to Wednesday’s midrange as the pair fails to move decisively in either direction. US data was mixed, while AUD traders will brace for an additional round of Australian jobs data.
US retail sales for October beat expectations but still posted some declines and came in at -0.1% versus the forecast of -0.3%, and the September reading was revised up from 0.7% to 0.9%.
The US Producer Price Index (PPI) excluding food and energy also came in slightly below expectations at 2.4%, versus 2.7% expected.
Australian market traders will be watching the jobs data that will be released early in the session on Thursday.
The change in Australian employment for October is expected to show an increase of 20,000 additional jobs for the month, up from 6.7 thousand in September. Meanwhile, the Australian unemployment rate is expected to rise from 3.6% to 3.7% in October.
AUD/USD Technical Outlook
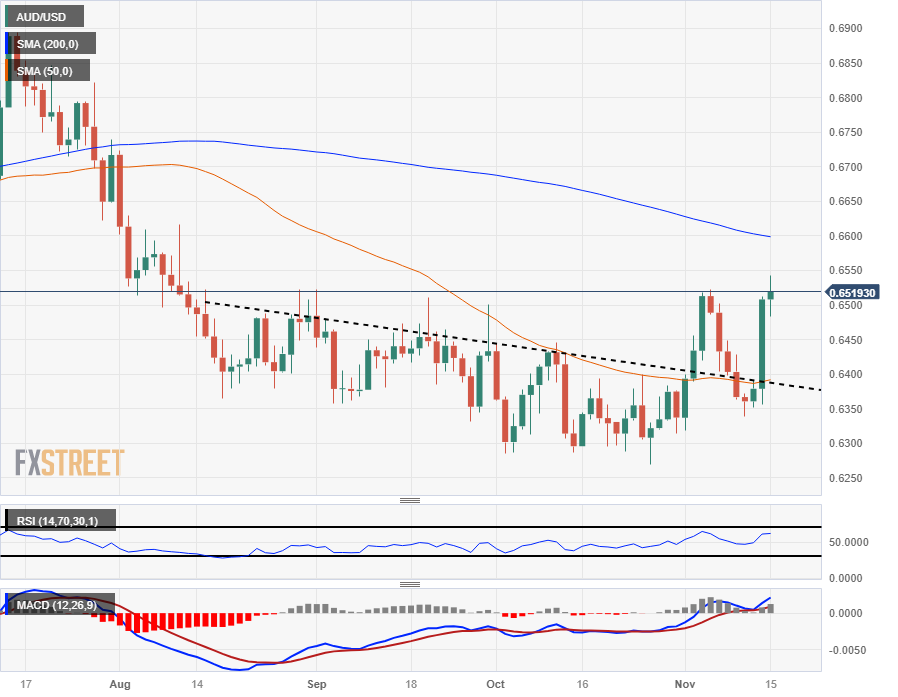
The AUD/USD pair is getting stuck in the 0.6500 area, an area that should make bidders nervous as it is the turning point for prices at the beginning of the month, and it seems that the pair is running out of gas of its recent bullish rebound.
There is still a significant price ceiling at the 200-day SMA near 0.6600, and the floor in any bearish correction lies at the 50-day SMA at 0.6400, with bids trapped in between.
AUD/USD Daily Chart
AUD/USD technical levels
Source: Fx Street
I am Joshua Winder, a senior-level journalist and editor at World Stock Market. I specialize in covering news related to the stock market and economic trends. With more than 8 years of experience in this field, I have become an expert in financial reporting.


