
- The US dollar is under pressure and scrutiny following the mixed US NFP report.
- The bears are looking at the weekly chart for clues as to where the dollar might be correcting.
The U.S. dollar, measured against a basket of major currencies in the DXY index, faltered after the release of the US Department of Labor’s non-farm payrolls employment report, which was widely watched. While the data showed an increase of 315,000 jobs last month, following a 526,000 increase in July, disappointments came on the heels of median hourly earnings, which rose 0.3% versus expectations of 0.4%, and the unemployment rate, which disappointed expectations of 3.5% vs. 3.7%. However, the higher-than-expected participation rate could go some way towards explaining this failure, given the increase in the number of people entering the labor force last month.
Despite the mixed data, traders see a 75% chance of a third consecutive 75 basis point rate hike in September and expect rates to peak at 3.90% in March 2023. Since then, the dollar has recovered from the sell-off and daily lows at 109.049 and is attempting to hold onto the correction at 109.20 at the time of writing. It had bounced back to 109.46, so it remains slightly under pressure. US yields are also under pressure, with the 2-year US Treasury yield down more than 2.57% to lows of 3.406%.
The US dollar index hit a new 20-year high at 109.99 on Thursday, buoyed by strong US data, leaving the DXY on track for a 0.5% weekly gain at the close. However, given that the data has a bit of everything, it does take some of the pressure off the Federal Reserve which is looking to cool job demand and the broader economy to bring inflation back to its 2% target, which is a factor that may weigh on the greenback for the next few days as the markets continue to digest the implications. Traders will be keeping an eye on the August consumer price index report due in the middle of this month for clues on the next rate hike ahead of the Fed meeting.
1 hour chart (DXY)
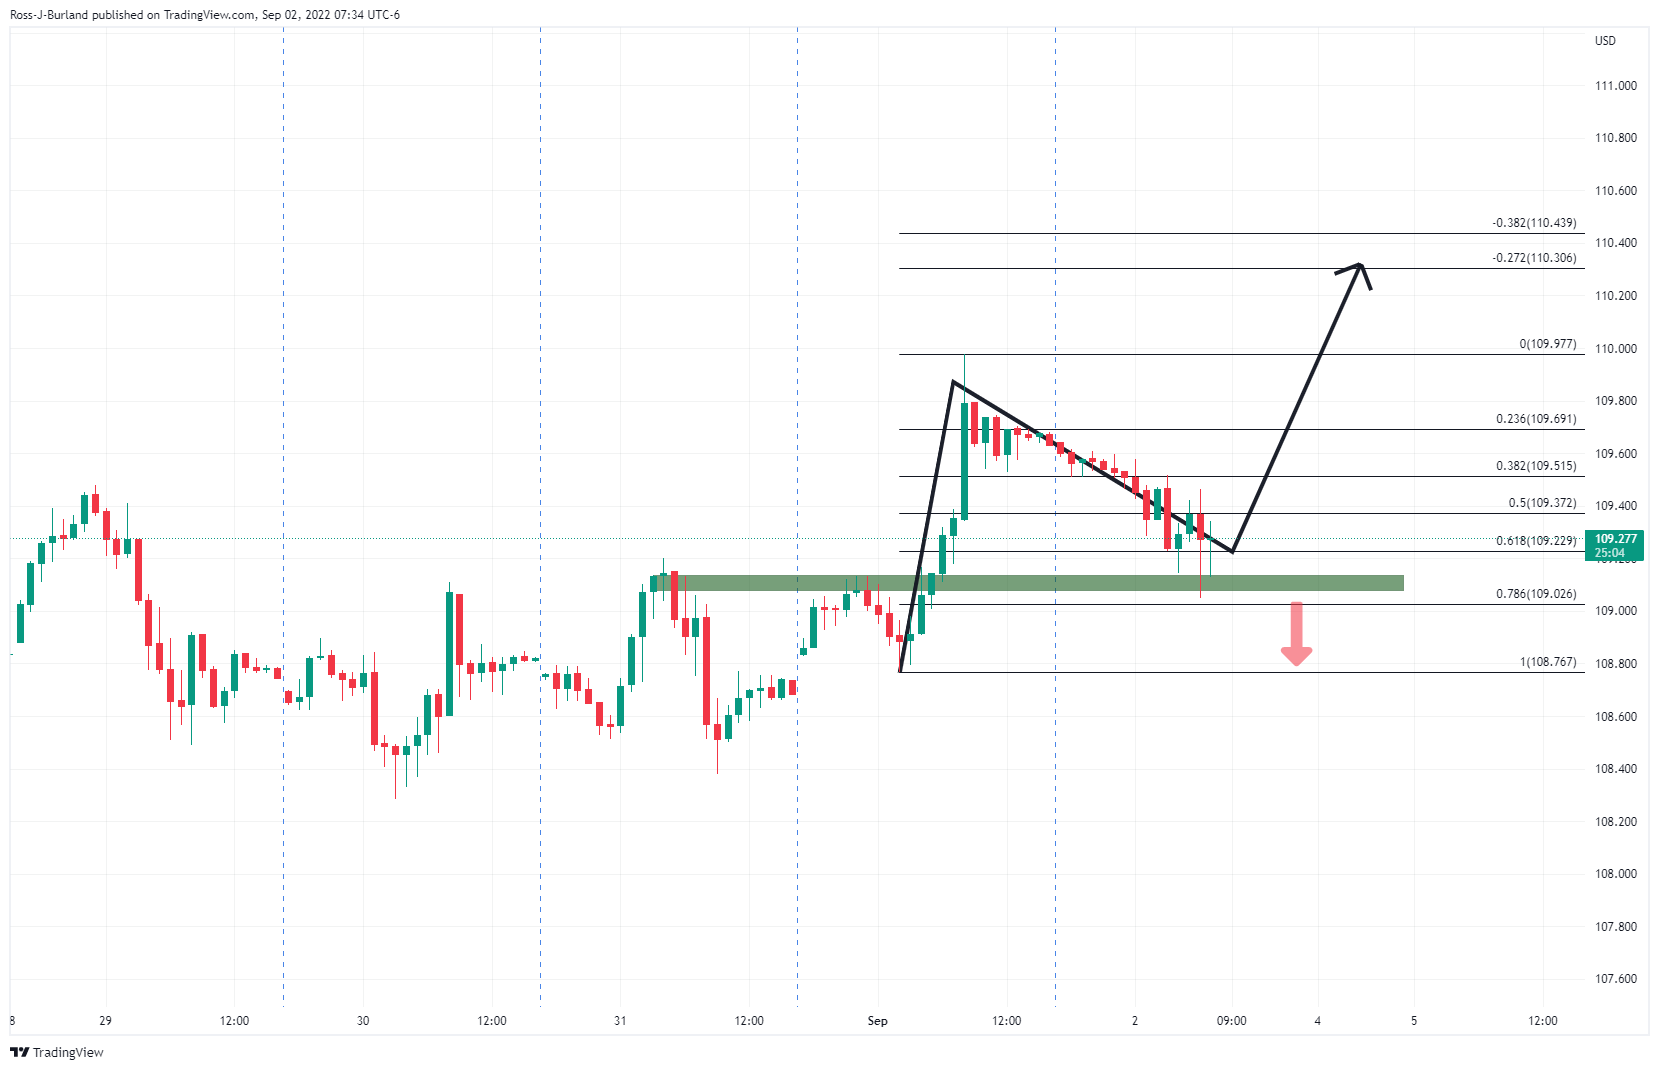
Technically, the index is attempting to settle around a 61.8% retracement level from the previous hourly bullish momentum. If the bulls commit, there will be prospects for a bullish extension today and open next week with an eye on the 110.00 level. On the other hand, if the support zone gives way, a deeper correction of weekly bullish momentum could follow next week:
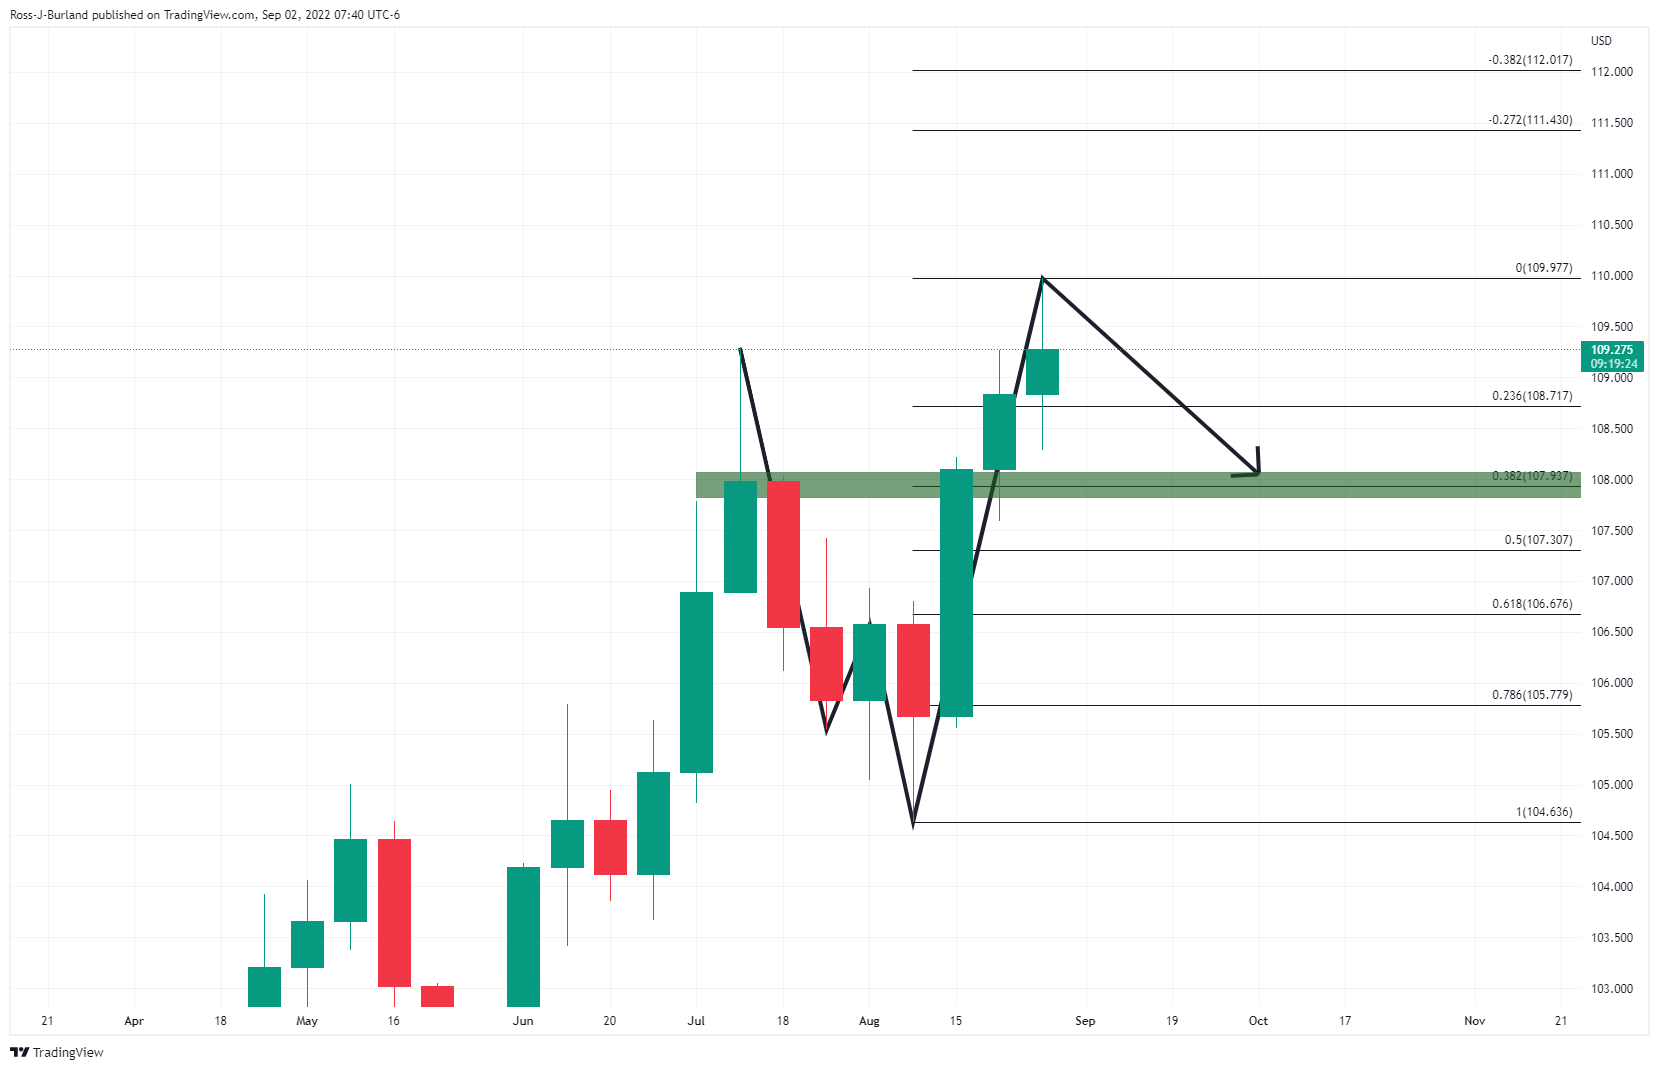
The W formation on the weekly chart is a reversal pattern and there is prospect of a correction back to the previous highs which are met by the 38.2% retracement.
Source: Fx Street
With 6 years of experience, I bring to the table captivating and informative writing in the world news category. My expertise covers a range of industries, including tourism, technology, forex and stocks. From brief social media posts to in-depth articles, I am dedicated to creating compelling content for various platforms.


