
- DXY maintains the recovery and flirts with 114.80.
- Further gains should hit the next hurdle at the 115.00 level.
The Dollar Index (DXY) continues to push higher and hits new two-decade highs at the 114.75/80 band on Wednesday.
The index appears to ignore current extreme overbought levels and could extend the march north to initially the round 115.00 level prior to the May 2002 high at 115.32.
Prospects for further dollar gains should remain unchanged as long as the index trades above the 7-month support line just above 107.00.
In the longer term, DXY is expected to maintain its constructive stance as long as it is above the 200 SMA at 102.30.
DXY day chart
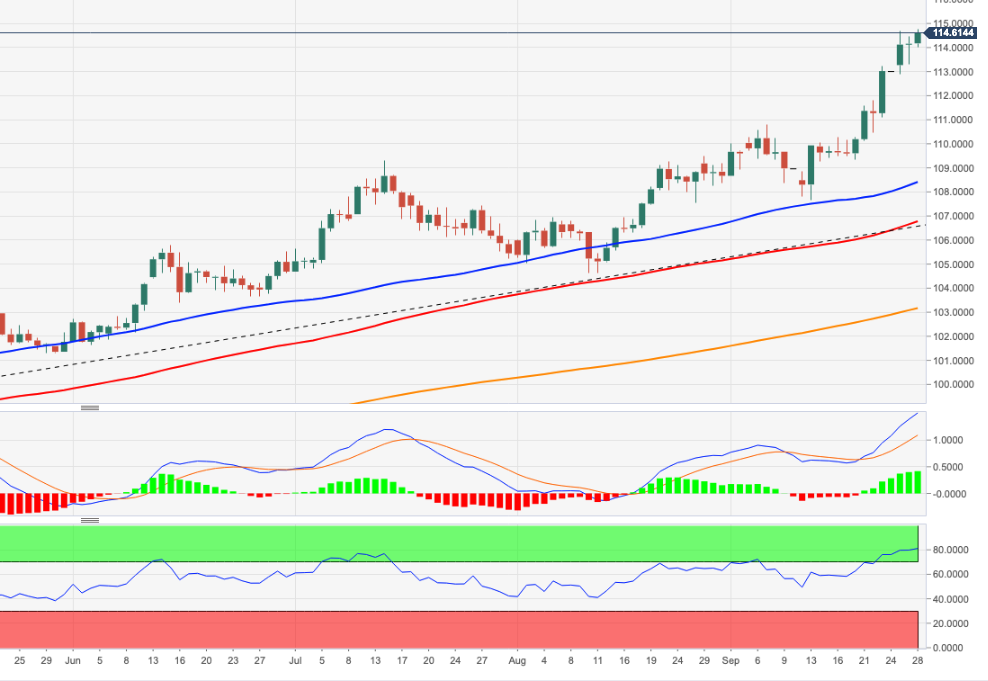
Source: Fx Street
With 6 years of experience, I bring to the table captivating and informative writing in the world news category. My expertise covers a range of industries, including tourism, technology, forex and stocks. From brief social media posts to in-depth articles, I am dedicated to creating compelling content for various platforms.

 marriage of Tom Cruise and Mimi Rogers has left his mark on both: Scientology, age difference and a controversial interview after the divorce")


