
- The Dow Jones loses 0.2% on Monday after the acceleration of the New York Fed inflation survey.
- Markets remain confident that the Fed will cut rates in 2024.
- US PPI and CPI inflation numbers are coming next week.
The Dow Jones Industrial Average (DJIA) started the week higher, but suffered a setback after the Federal Reserve Bank (Fed) of New York revealed that consumers' inflation expectations for next year accelerated to 3.3%. The New York Fed's one-year consumer inflation expectations have risen from 3.0% previously, as price growth continues to chip away at consumers' purchasing power.
On Tuesday, inflation data from the US Producer Price Index (PPI) will be published. Markets expect core PPI inflation for the year to April to remain stable at 2.4%. US Consumer Price Index (CPI) inflation data will be updated on Wednesday, with monthly CPI inflation expected to remain stable at 0.4%.
Despite rising consumer inflation expectations, market participants continue to lean toward Fed rate cut hopes. According to the CME's FedWatch tool, rates markets are pricing the odds at 65%. of a rate cut in September, and a 90% chance of at least one rate cut before the end of the year. Market bets on rate cuts have begun to decouple from broader expectations, with a Reuters poll of economists finding that nearly two-thirds of respondents expected a cut in September. At the same time, economists surveyed also do not see inflation reaching the Fed's 2% target until 2026, complicating the prospects for Fed rate cuts.
Dow Jones News
The Dow Jones loses about a fifth of a percentage point on Monday, with half of the stocks that make up the index in the red in the day's trading session. Home Depot Inc. (HD) leads the index declines, with a decline of -1.4% and a loss of around 5 points, trading at $351.52 per share. On the positive side, Intel Corp. (INTC) rose about 2.7% to $30.64 per share.
Dow Jones Technical Outlook
The Dow Jones Industrial Average rose to 39,640.00 early Monday before an intraday decline, bouncing back to the 39,400.00 level as the major stock index wavers within technical levels established late last week.
Daily candlesticks show that the Dow Jones is about to pull back, as the index continues to trade at the top of a seven-day winning streak, having risen about 5% from the last swing low at 37,600, 00. The Dow Jones' recent bullish run has seen the index hit all-time highs just below the 40,000.00 level, and the bulls remain in control, with prices north of the 200-day EMA. at 36,938.27 points.
Dow Jones five minute chart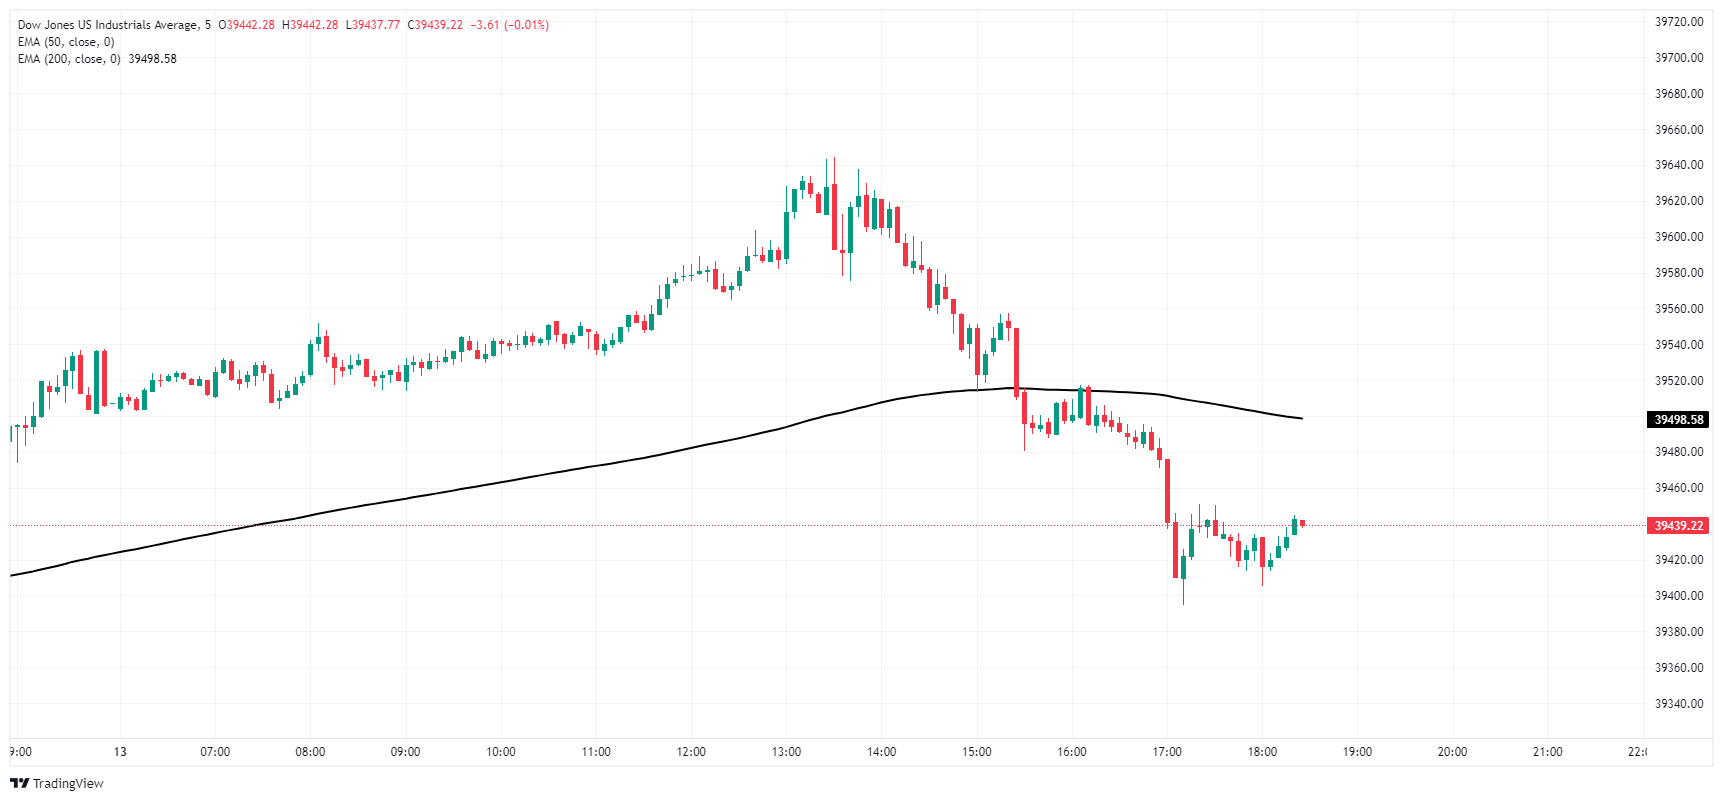
Dow Jones Daily Chart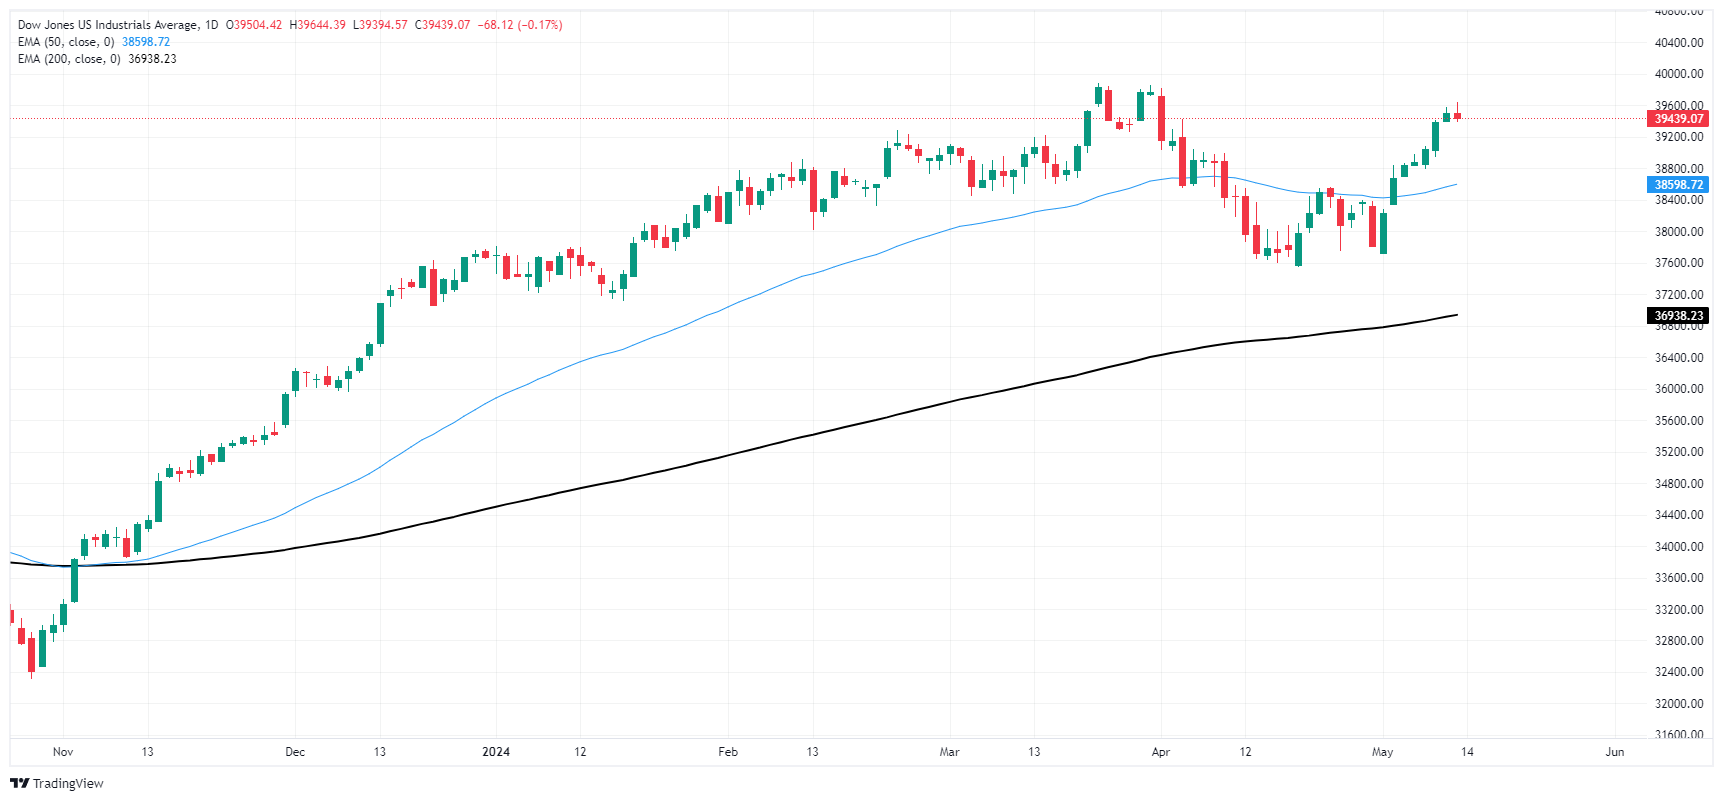
Frequently Asked Questions About the Dow Jones
What is the Dow Jones?
The Dow Jones Industrial Average, one of the world's oldest stock indices, is made up of the 30 most traded securities in the United States. The index is weighted by price rather than capitalization. It is calculated by adding the prices of the securities that comprise it and dividing them by a factor, currently 0.152. The index was founded by Charles Dow, also founder of the Wall Street Journal. In recent years it has been criticized for not being sufficiently representative, since it only follows 30 companies, unlike broader indices such as the S& P 500.
What factors influence the Dow Jones index?
There are many factors that drive the Dow Jones Industrial Average (DJIA). The main one is the aggregate performance of its component companies, revealed in quarterly corporate earnings reports. US and global macroeconomic data also contribute, influencing investor sentiment. The level of interest rates, set by the Federal Reserve (Fed), also influences the DJIA, as it affects the cost of credit, on which many companies largely depend. Therefore, inflation can be a determining factor, as well as other parameters that influence the Federal Reserve's decisions.
What is the Dow theory?
The Dow Theory is a method of identifying the main trend of the stock market developed by Charles Dow. A key step is to compare the direction of the Dow Jones Industrial Average (DJIA) and the Dow Jones Transportation Average (DJTA) and only follow trends where both are moving in the same direction. Volume is a confirmation criterion. The theory uses elements of maximum and minimum analysis. The Dow theory proposes three phases of the trend: accumulation, when the smart money begins to buy or sell; public participation, when the general public joins the trend; and distribution, when the smart money abandons the trend.
How can I trade with the DJIA?
There are several ways to trade the DJIA. One of them is to use ETFs that allow investors to trade the DJIA as a single security, instead of having to buy shares of the 30 companies that comprise it. A prominent example is the SPDR Dow Jones Industrial Average ETF (DIA). Futures contracts on the DJIA allow traders to speculate on the future value of the index, and options provide the right, but not the obligation, to buy or sell the index at a predetermined price in the future. Mutual funds allow investors to purchase a portion of a diversified portfolio of DJIA securities, providing exposure to the global index.
Source: Fx Street
I am Joshua Winder, a senior-level journalist and editor at World Stock Market. I specialize in covering news related to the stock market and economic trends. With more than 8 years of experience in this field, I have become an expert in financial reporting.


