
- The DXY Index succumbs to the selling pressure and breaks the 106.00 level.
- A deeper pullback opens the door to a November low near 105.30.
The DXY index maintains the bearish trend in the second half of the week, falling below the support of 106.00.
Should the selling pressure pick up, the dollar could give up more ground and target the November low at 105.34 (15 Nov). This area of contention seems to be underpinned by the proximity of the ever-relevant 200-day SMA, today at 105.27.
As long as it is above the 200-day SMA, the outlook for the DXY Index should remain constructive.
DXY index daily chart
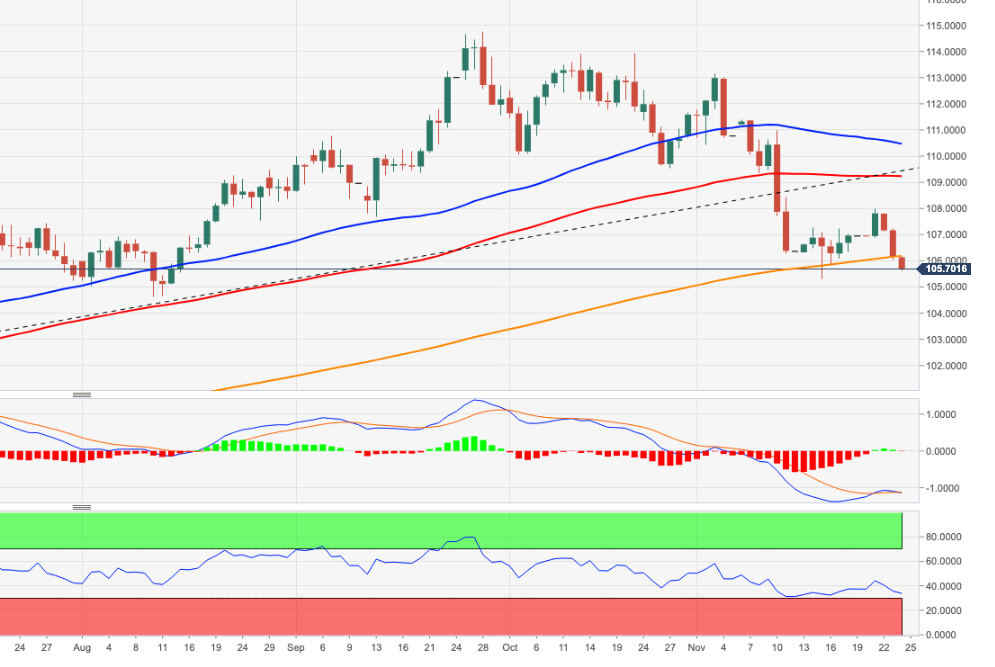
Source: Fx Street
I am Joshua Winder, a senior-level journalist and editor at World Stock Market. I specialize in covering news related to the stock market and economic trends. With more than 8 years of experience in this field, I have become an expert in financial reporting.


")
