
- The DXY index remains under pressure below the 103.00 level.
- A further drop could lead to a drop to the 102.30 region.
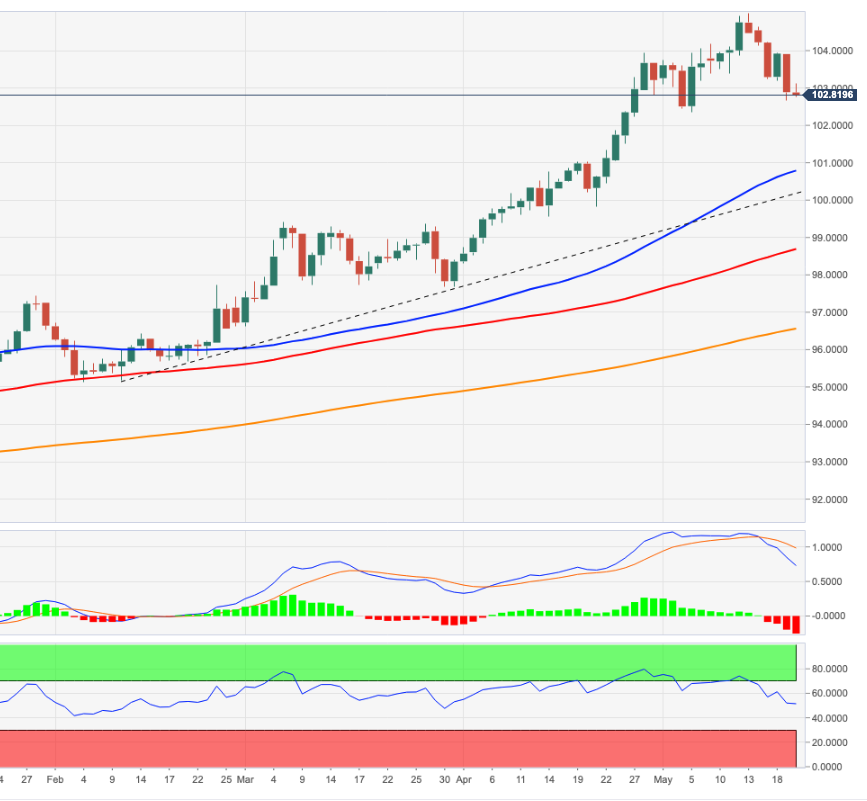
The US Dollar Index (DXY) keeps the bearish tone so far unchanged below 103.00 at the end of the week.
The index remains under pressure and therefore further losses should not be ruled out at the moment. Against that, a likely pullback to the May low at 102.35 (5th May low) remains on the table in the not so distant future.
Looking with a broader perspective, the index’s current bullish stance remains supported by the 3-month line around 100.30, while the longer-term outlook for the dollar looks constructive as long as it is above the 200 SMA. days at 96.54.
DXY day chart
Source: Fx Street
With 6 years of experience, I bring to the table captivating and informative writing in the world news category. My expertise covers a range of industries, including tourism, technology, forex and stocks. From brief social media posts to in-depth articles, I am dedicated to creating compelling content for various platforms.


