
- DXY made a U-turn shortly after hitting new lows near 101.40.
- The support line near 100.60 supports the constructive view.
The index changes course after bottoming in the 101.40 region on Friday.
Should we lose the May low at 101.43 (May 27), the DXY would be exposed to another retracement to the intermediate 55-day simple moving average (SMA) at 101.47 ahead of the support line around 100.60, which is expected to offer decent containment. If it continues above this area, additional very short-term dollar gains should remain on the table.
The positive long-term outlook for the index is seen as constructive as long as it is above the 200-day SMA at 96.76.
DXY day chart
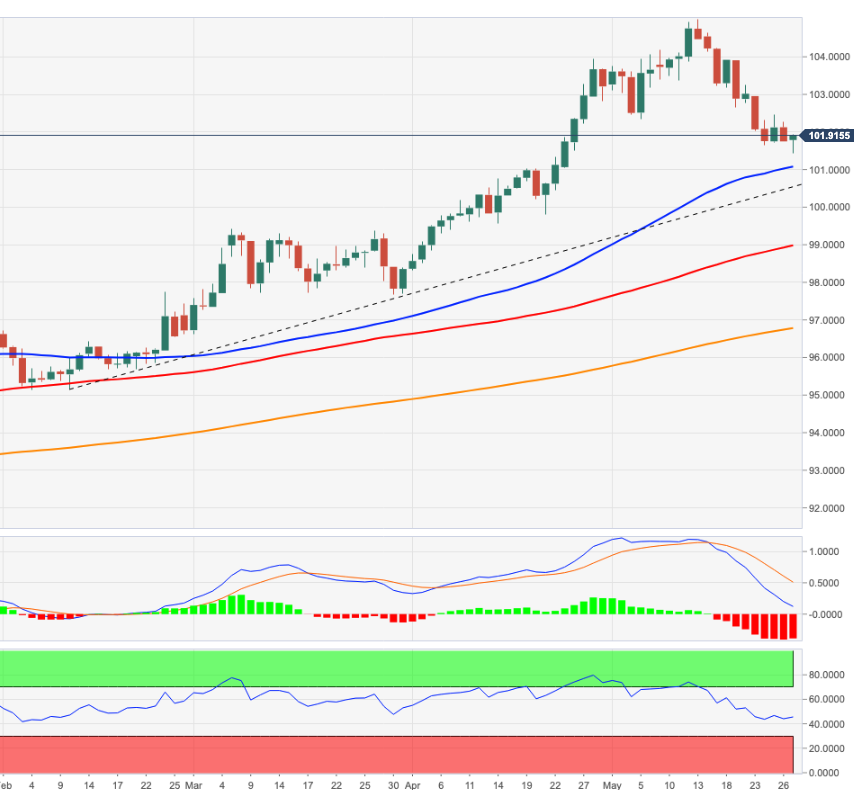
Source: Fx Street
With 6 years of experience, I bring to the table captivating and informative writing in the world news category. My expertise covers a range of industries, including tourism, technology, forex and stocks. From brief social media posts to in-depth articles, I am dedicated to creating compelling content for various platforms.


