
- The Dollar Index starts the new year erratically.
- The multi-month low at 103.39 is shaping up to be the next support.
The dollar index (DXY) gives up most of Tuesday’s strong advance to the limits of the 105.00 barrier and returns to the area below 104.00 on Wednesday.
The index appears to have entered a consolidation phase, though the outlook remains to the downside as it remains below the key 200-day SMA at 106.25.
A deeper pullback could revisit the multi-month low at 103.39 (30 Dec). The loss of this zone could leave the dollar vulnerable to further losses in the short term.
DXY day chart
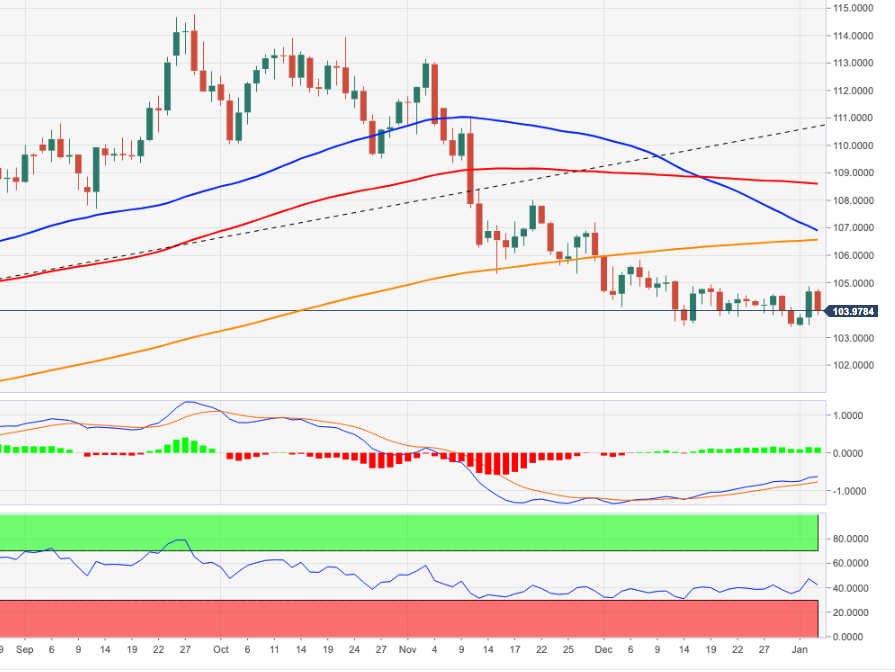
Source: Fx Street
I am Joshua Winder, a senior-level journalist and editor at World Stock Market. I specialize in covering news related to the stock market and economic trends. With more than 8 years of experience in this field, I have become an expert in financial reporting.


