
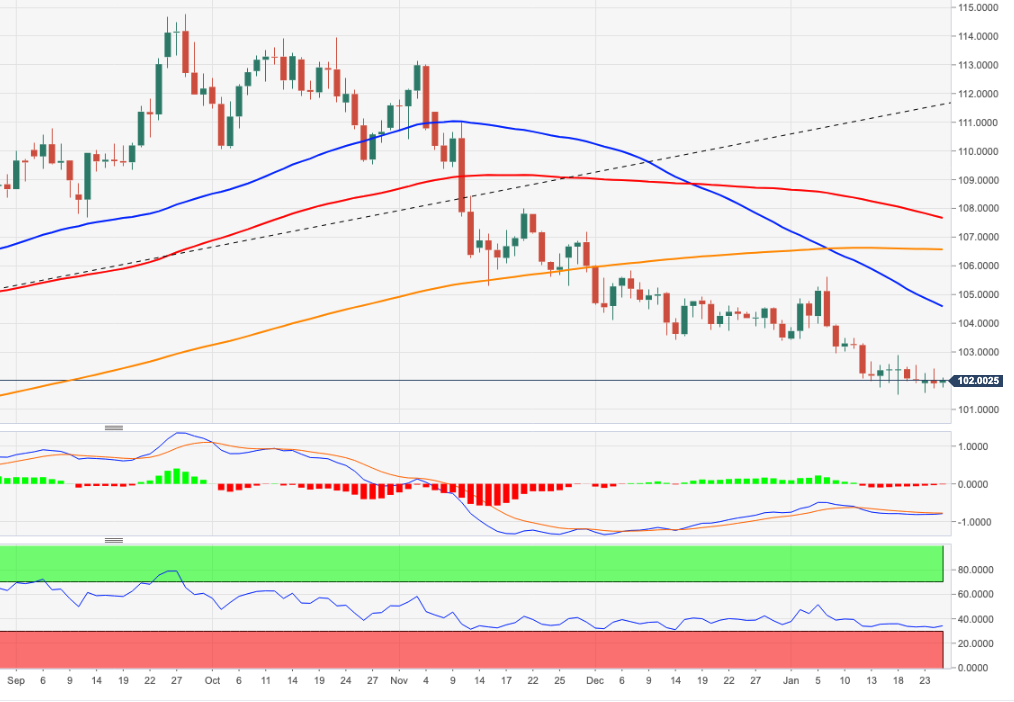
- The DXY remains range bound around 102.00.
- Upside attempts face an immediate hurdle at the 103.00 zone.
The US Dollar Index (DXY) extends the sideways trend for another day, and remains near the 102.00 area on Wednesday.
At the moment, we must not rule out a continuity within the range. Should the bears regain control, the index could pull back further and revisit the 2023 low at 101.52 (Jan 18) before the May 2022 low around 101.30 (May 30), all before the psychological barrier of 100.00.
To the upside, the weekly high of 102.89 (Jan 18) is expected to offer initial resistance.
Meanwhile, if it remains below the 200-day SMA at 106.46, the outlook for the index should remain negative.
DXY day chart
Source: Fx Street
I am Joshua Winder, a senior-level journalist and editor at World Stock Market. I specialize in covering news related to the stock market and economic trends. With more than 8 years of experience in this field, I have become an expert in financial reporting.


 meeting for peace: “First step towards reconciliation”")


