
- The DXY index leaves behind Wednesday’s gains.
- A further drop could lead to a drop to the 102.30 region.
The US dollar index (DXY) it extends the turmoil observed so far this week and reverses the advance of the previous session.
Despite the current bounce, further pullbacks remain on the table and could now target the next support at 102.35 (May low), where firm support is expected to emerge.
Looking at the bigger picture, the index’s current bullish stance remains supported by the 3-month line around 100.20, while the longer-term outlook for the dollar looks constructive as long as it is above the 200-day simple moving average. at 96.49.
DXY day chart
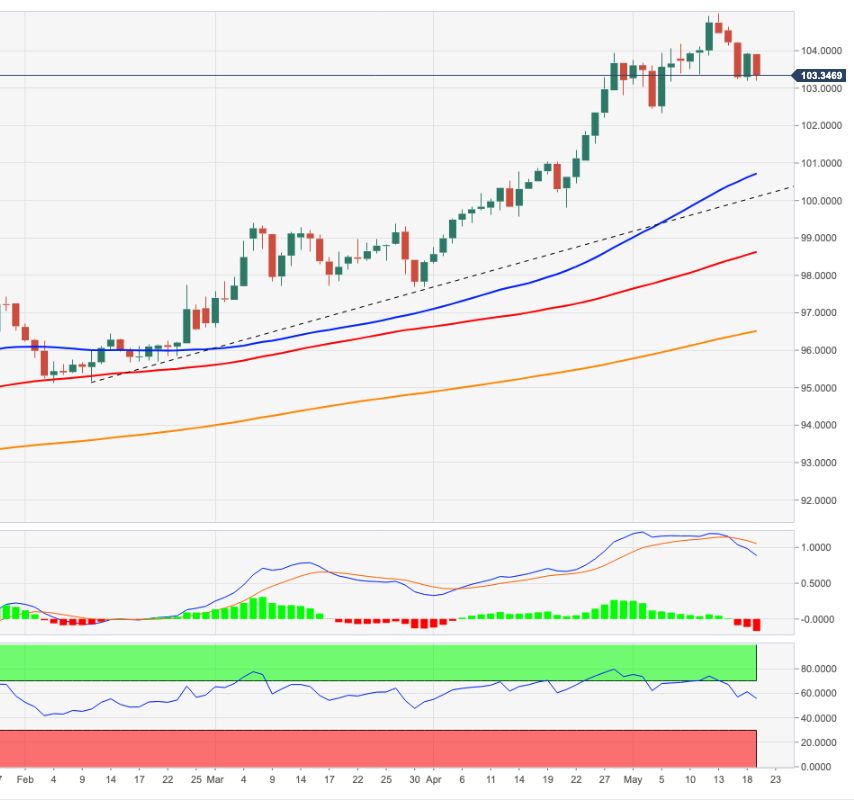
Source: Fx Street
With 6 years of experience, I bring to the table captivating and informative writing in the world news category. My expertise covers a range of industries, including tourism, technology, forex and stocks. From brief social media posts to in-depth articles, I am dedicated to creating compelling content for various platforms.


")