
- EUR/AUD gains 0.67% after RBA keeps rates steady, signaling a dovish outlook with easing inflationary pressures.
- Despite the gains, potential ECB rate cuts are looming, influencing the short-term trading dynamics for the cross pair.
- Technical levels to watch: Support at 1.6450 and 1.6400, with resistance near the recent peak at 1.6540.
EUR/AUD soared to a new two-day peak on Tuesday after the Reserve Bank of Australia (RBA) kept rates unchanged but took a dovish stance as they signaled inflation is starting to ease towards its 3% target. At the time of writing, the cross pair is trading at 1.6497, with gains of over 0.67%.
EUR/AUD Price Forecast: Technical Outlook
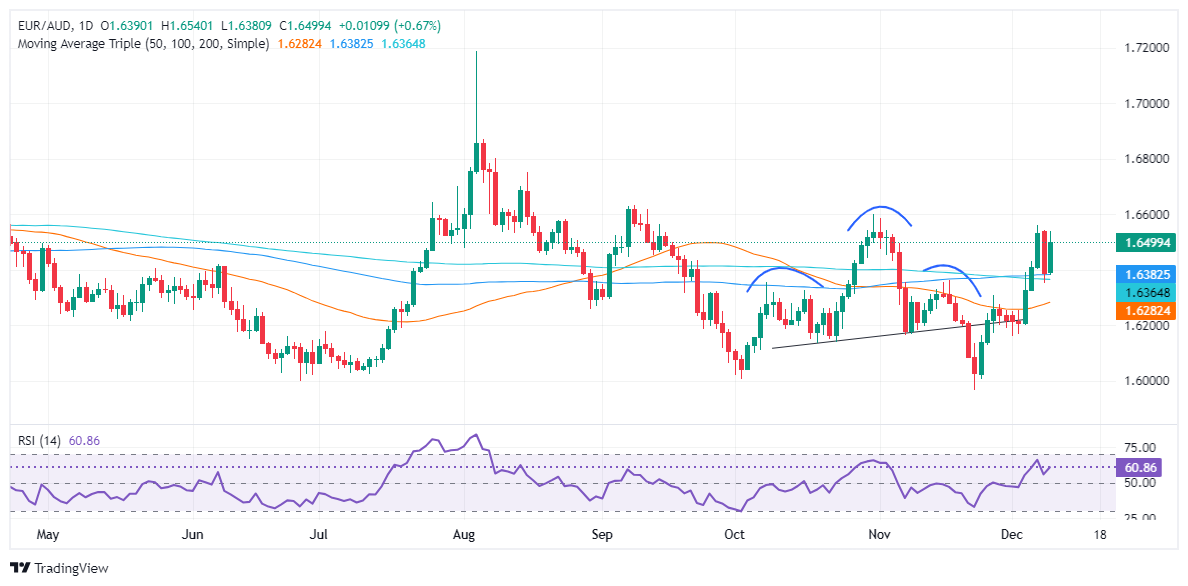
The pair started the week lower, but the RBA decision pushed the EUR/AUD towards a two-day high of 1.6540. However, traders pared some of those gains as the European Central Bank (ECB) is expected to cut rates at its December 12 meeting.
Momentum remains slightly bullish, although the Relative Strength Index (RSI) suggests that sellers have the upper hand in the short term.
The first support for EUR/AUD would be the 1.6450 area, followed by the psychological mark of 1.6400. In case of further weakness, the next support would be the 100-day SMA at 1.6382, followed by the 200-day SMA at 1.6364. A break of the latter will expose 1.6300.
Conversely, if buyers break 1.6500, immediate resistance would be 1.6540, followed by 1.6561, the December 6 peak.
EUR/AUD Price Chart – Daily
Euro PRICE Today
The table below shows the percentage change of the Euro (EUR) against the main currencies today. Euro was the strongest currency against the Japanese Yen.
| USD | EUR | GBP | JPY | CAD | AUD | NZD | CHF | |
|---|---|---|---|---|---|---|---|---|
| USD | 0.00% | -0.01% | 0.02% | 0.00% | -0.00% | -0.04% | 0.01% | |
| EUR | -0.00% | -0.02% | 0.03% | -0.00% | -0.01% | -0.05% | 0.00% | |
| GBP | 0.01% | 0.02% | 0.02% | 0.02% | 0.00% | -0.03% | 0.02% | |
| JPY | -0.02% | -0.03% | -0.02% | -0.01% | -0.02% | -0.06% | -0.01% | |
| CAD | -0.00% | 0.00% | -0.02% | 0.01% | -0.01% | -0.04% | 0.00% | |
| AUD | 0.00% | 0.01% | -0.01% | 0.02% | 0.00% | -0.04% | 0.04% | |
| NZD | 0.04% | 0.05% | 0.03% | 0.06% | 0.04% | 0.04% | 0.06% | |
| CHF | -0.01% | -0.01% | -0.02% | 0.00% | -0.01% | -0.04% | -0.06% |
The heat map shows percentage changes for major currencies. The base currency is selected from the left column, while the quote currency is selected from the top row. For example, if you choose the Euro from the left column and move along the horizontal line to the US Dollar, the percentage change shown in the box will represent EUR (base)/USD (quote).
Source: Fx Street
I am Joshua Winder, a senior-level journalist and editor at World Stock Market. I specialize in covering news related to the stock market and economic trends. With more than 8 years of experience in this field, I have become an expert in financial reporting.


