
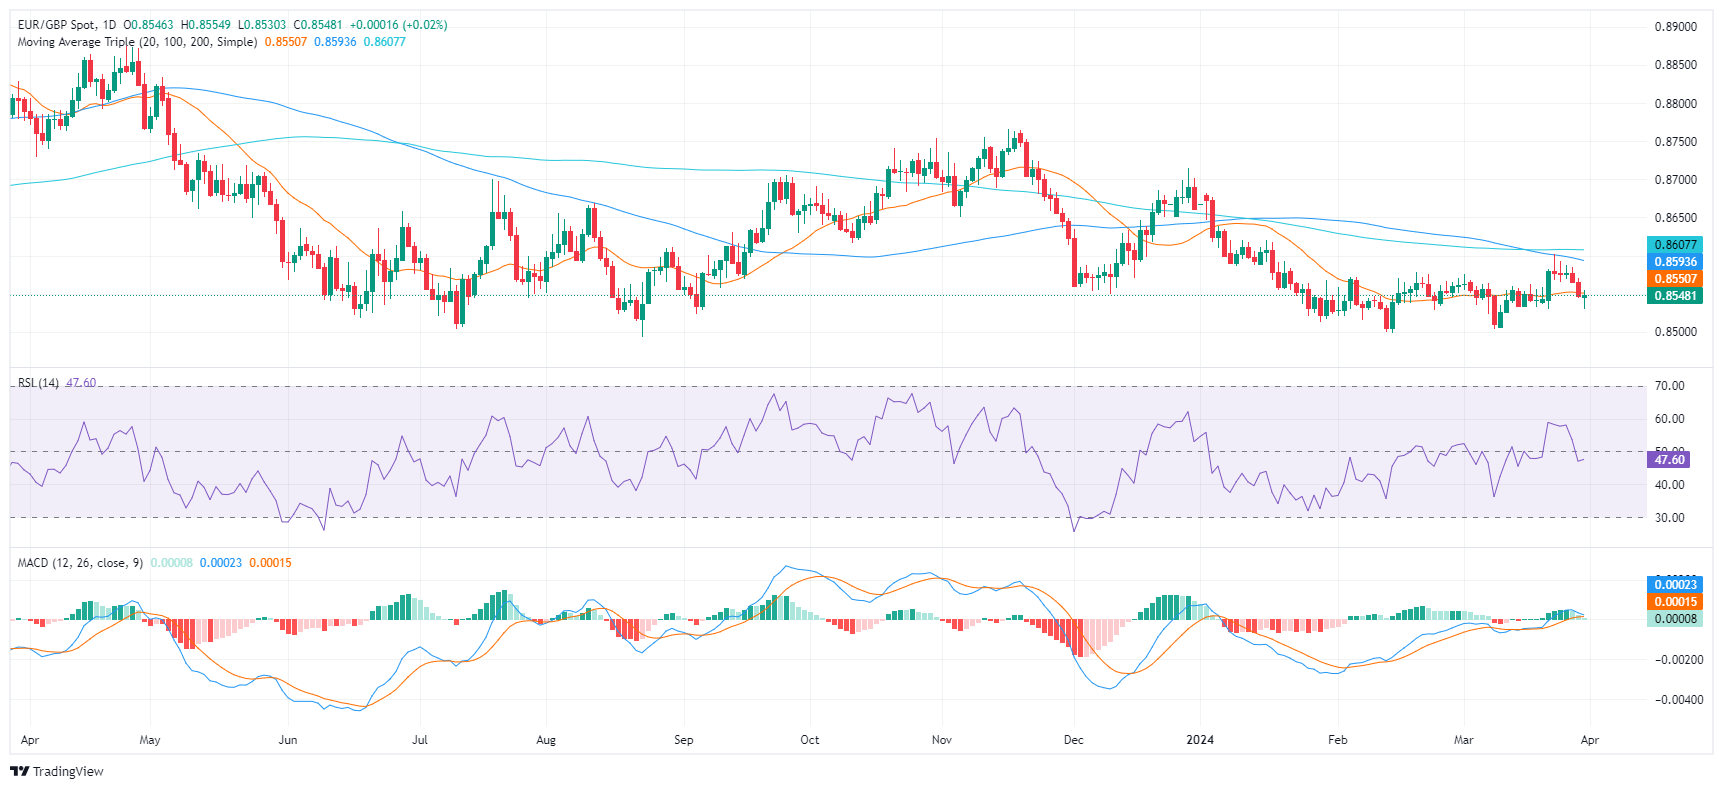
- The daily chart shows a mostly bearish environment with somewhat flat indicators.
- The hourly chart shows a possible bearish turn with the RSI close to the neutral-negative zone.
The EUR/GBP cross is currently trading at 0.8550, with slight losses in the Friday session. Sellers are exerting their presence as bullish momentum remains weak and the fact that the cross remains below its main 20,100 and 200-day SMA contributes to the bearish bias.
On the daily chart, the Relative Strength Index (RSI) is currently in negative territory, but remains flat, while the MACD prints neutral green bars, suggesting stagnant momentum. This shows that the trend could continue in the short term.
EUR/GBP daily chart
On the hourly chart, the RSI is showing a mixed trend, with readings ranging from 33 and then recovering to 50, sitting on the edge of neutral-negative territory. Along with the flat green bars on the MACD histogram, there could be a shift towards bearish momentum after the short rally by the bulls during the European session.
EUR/GBP 1-hour chart
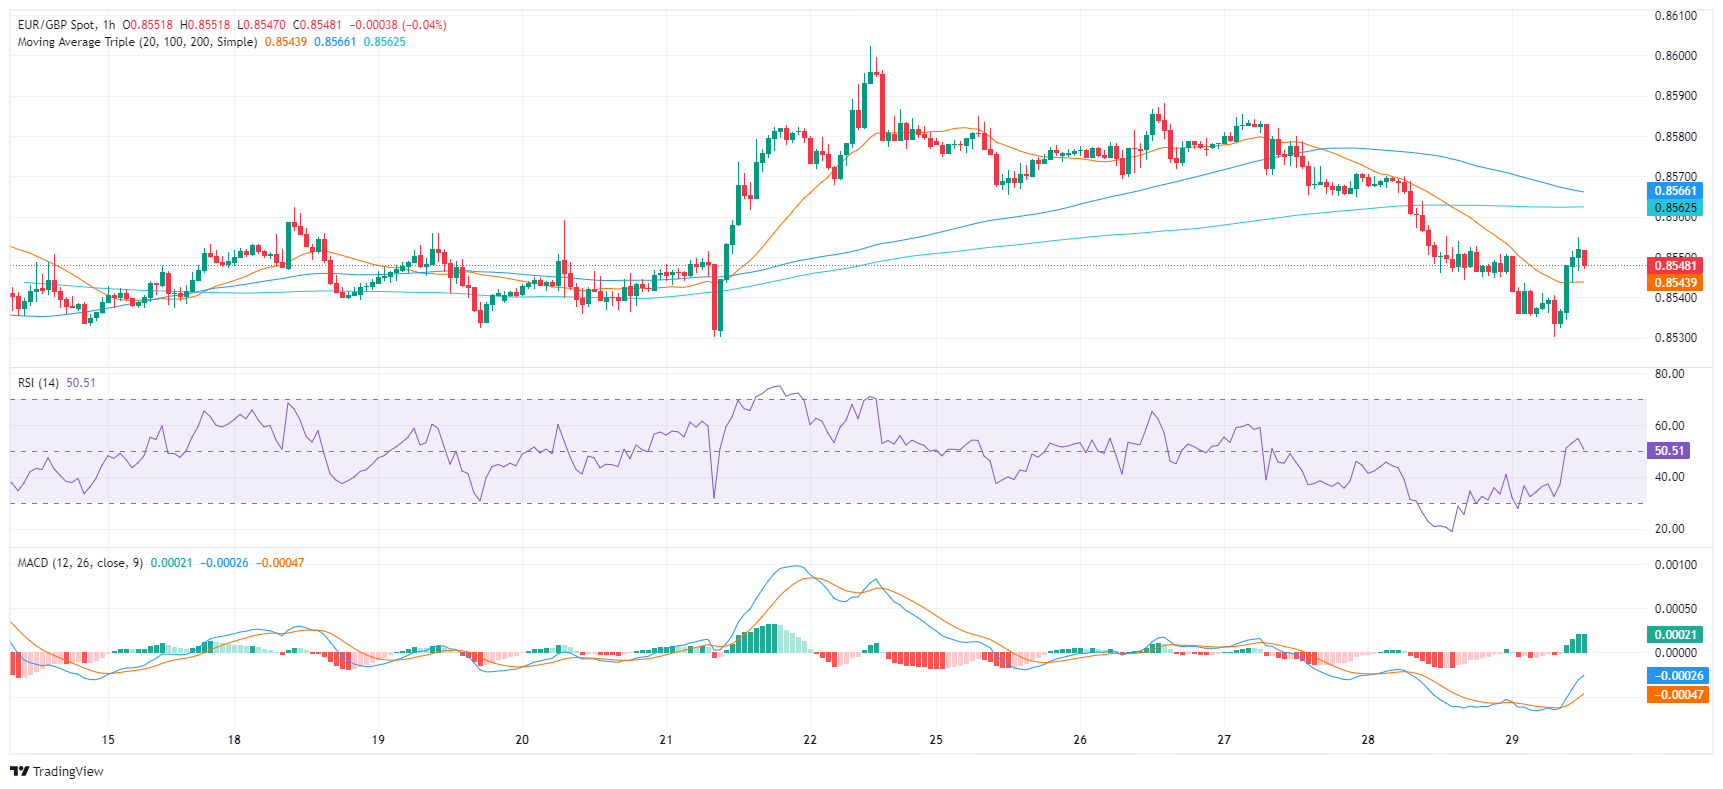
In conclusion, both the daily and hourly analysis point to a mainly negative trend for EUR/GBP, although with possible hourly fluctuations. If buyers want to avoid losses, they should reclaim the 200-day SMA around 0.8550 and create support around it.
Source: Fx Street
I am Joshua Winder, a senior-level journalist and editor at World Stock Market. I specialize in covering news related to the stock market and economic trends. With more than 8 years of experience in this field, I have become an expert in financial reporting.


